Figure 2.
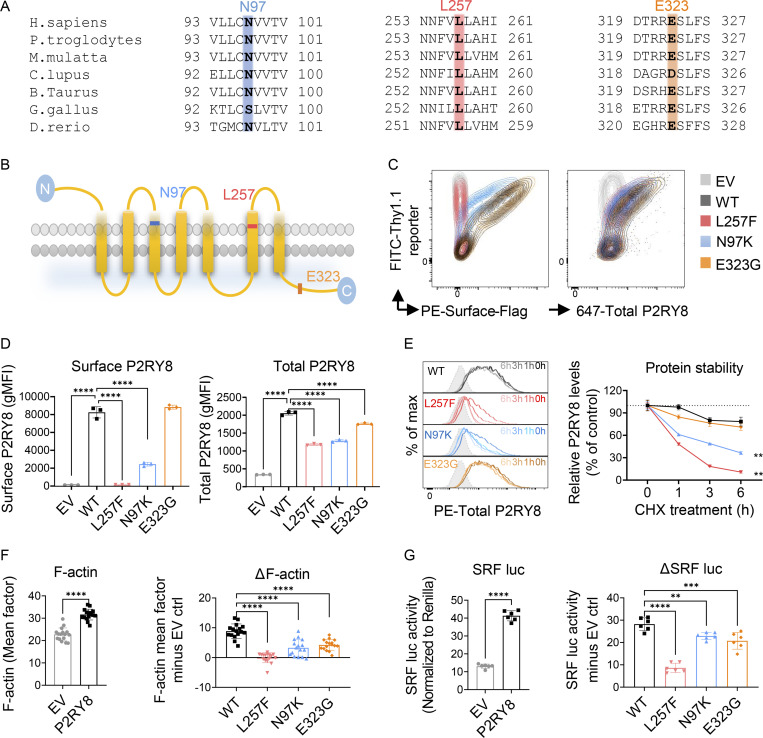
Characterization of P2RY8 variants indicate loss of function. (A) Evolutionary conservation of L257 (red), N97 (blue), and E323 (orange) in P2RY8. (B) Location of variants in the domains of human P2RY8. (C and D) NIH/3T3 cells were transduced with retroviruses encoding FLAG-tagged–WT-P2RY8–IRES-Thy1.1 or mutants. Representative FACS plots (C) and summary graphs (D) showing P2RY8 expression. Surface staining of P2RY8 with anti-FLAG (n = 3 for each group). Total P2RY8 staining with anti-P2RY8, which targets the cytoplasmic portion of P2RY8 (n = 3 for each group). EV, empty vector. (E) Degradation assay of WT or mutant P2RY8 proteins. Representative histograms and summary graphs showing P2RY8 expression after CHX treatment. Leftmost gray histogram (dotted line) depicts background staining in empty vector–transduced cells. Values are relative to time 0 and are means of three replicates. (F) Immunofluorescence analysis of F-actin expression. Basic intensity quantification was performed for each image. n = 16 images for each group. ΔF-actin was calculated as F-actin mean factor minus EV control (EV ctrl). (G) SRF luciferase (SRF luc) assay in HEK293 cells transfected with P2RY8-WT or mutants. (n = 6 for each group). ΔSRF activity was calculated as activity minus EV ctrl. Data are representative of three (C, D, and G), four (E), or six (F) independent experiments. P values determined by one-way ANOVA (D, F-right, and G-right), two-way ANOVA with Dunnett's multiple comparisons test (E), or unpaired t test (F-left and G-left). **, P < 0.01; ***, P < 0.001; ****, P < 0.0001. Graphs depict mean with SD. gMFI, geometric mean; max, maximum; PE, phycoerythrin.

