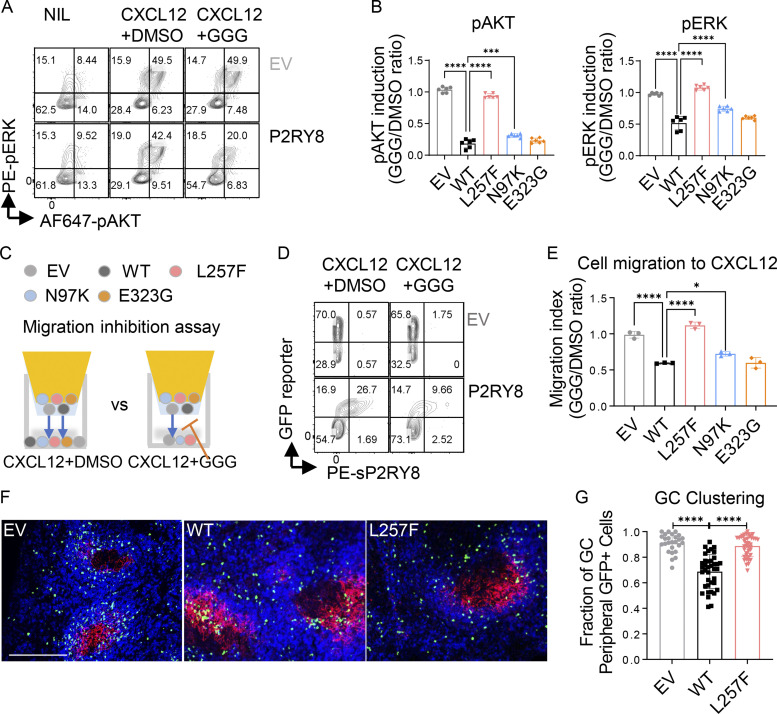
Figure 3.
Functional validation of P2RY8 variants in retrovirally transduced B cells. Purified splenic B cells were preactivated and transduced with retroviruses encoding P2RY8-IRES-GFP or mutants. (A and B) Transduced B cells were treated with either CXCL12+carrier (DMSO) or CXCL12+GGG. (A) Representative plots showing pAKT or pERK expression after treatments. (B) pAKT or pERK induction index was calculated as phosphorylation induced by CXCL12+GGG divided by mean value of phosphorylation induced by CXCL12+DMSO (n = 6 for each group). (C–E) Transwell assay of transduced B cells toward CXCL12+DMSO or CXCL12+50 nM GGG. Blue arrows indicate the direction of cell migration. Representative plots (D) and quantification (E) showing migrated cells of the indicated types. Migration index was calculated as cell migration to CXCL12+GGG divided by cell migration to CXCL12+DMSO (n = 3 for each group). Data in E is also representative of three experiments in transduced WEHI231 cells. (F and G) GC clustering behavior in transduced B cells. Immunofluorescence for P2RY8- or EV-transduced B cells (GFP, green) in the GCs (CR1, red) of SRBC immunized mice relative to endogenous follicular B cells (IgD, blue). Scale bar, 200 µm. (G) Quantification of GFP+ cells in the outer region of a B cell follicle as a fraction of total GFP+ cells in a follicle. Each point represents a B cell follicle, and all follicles of a defined size or larger were quantified from three spleen sections per mouse (n = 26 EV, 38 WT, 41 L257F). Data representative of two (F and G) or at least five (A–E) independent experiments. P values determined by one-way ANOVA with Dunnett's multiple comparisons (B, E, and G). *, P < 0.05; ***, P < 0.001; ****, P < 0.0001. Graphs depict mean with SD. EV, empty vector; NIL, non-treated control; PE, phycoerythrin.

