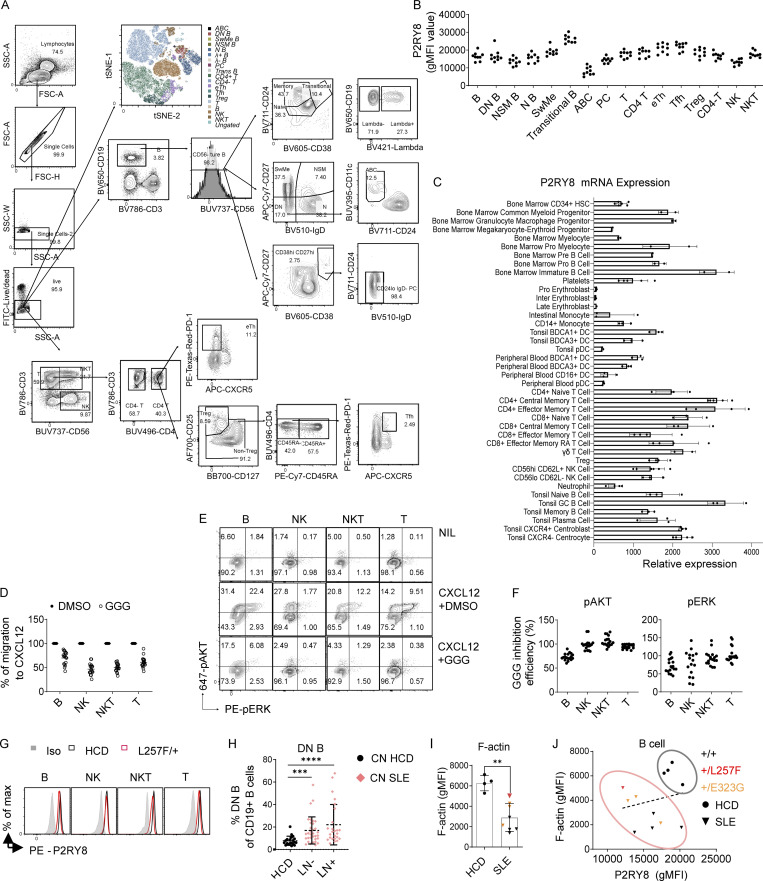
Figure S3.
GGG-mediated inhibition of AKT and ERK activation and cell migration in human PBMCs. (A) Gating strategy for PBMC immunophenotyping. (B) Summary graph showing P2RY8 levels in different PBMC subsets. (n = 9 healthy subjects). (C) P2RY8 mRNA expression in immune cells. Expression data from BioGPS (Wu et al., 2013), using the Primary Cell Atlas database, a meta-analysis of publicly available microarray datasets derived from human primary cells. (D) Transwell migration assay toward 200 ng/ml CXCL12 along with 100 nM GGG (GGG) or vehicle (DMSO). (E and F) Representative FACS plots (E) and summary graphs (F) showing pAKT and pERK levels in B, natural killer (NK), natural killer T (NKT), or T cells treated with CXCL2+DMSO or CXCL12+GGG. (n = 9 subjects, two replicates for each subject.) GGG Inhibition Efficiency (%) = 100* ([CXCL12+GGG] %-NIL%)/([CXCL12+DMSO] %-NIL%). (G) Representative histograms showing P2RY8 expression in a healthy control and patient with +/L257F variant. Iso, isotype control. (H) Summary graph showing frequency of CD27 IgD DN B cells in CD19+ B cells. n = 20, HCD; n = 33, lupus nephritis (LN)−; n = 25, LN+. CN HCD, Chinese healthy donors; CN SLE, Chinese SLE patients. P values determined by Mann-Whitney test. (I) Summary graphs showing F-actin expression in B cells. n = 4, HCD; n = 8, SLE. Red dot, +/L257F (n = 1); orange dots, +/E323G (n = 3). (J) Correlation analysis between P2RY8 and F-actin expression levels in B cells. n = 4, HCD; n = 8, SLE. Red dot, +/L257F (n = 1); orange dots, +/E323G (n = 3). Data were representative of at least five (B–F) or four (H) independent experiments. P values determined by Mann-Whitney test (H and I) or by correlation analysis (J). **, P < 0.01; ***, P < 0.001; ****, P < 0.0001. Graphs depict mean with SD, and points represent biological replicates. ABC, age-associated B cells; eTh, extrafollicular helper T cells; effector memory RA T, effector memory T cells re-expressing CD45RA; FSC-A, forward scatter A; FSC-H, forward scatter H; gMFI, geometric mean; HSC, hematopoietic stem cells; inter, intermediate; max, maximum; N B, naive B cells; NIL, non-treated control; NK, Natural killer cells; NKT, Natural killer T cells; NSM B, non-switched memory B cells; PC, plasma cell; pro, progenitor; PE, phycoerythrin; SSC-A, side scatter A; SSC-W, side scatter W; SwMe, switched memory B cells; Trans B, transitional B cells; Treg, T regulatory cell; Tfh, T follicular helper cells.

