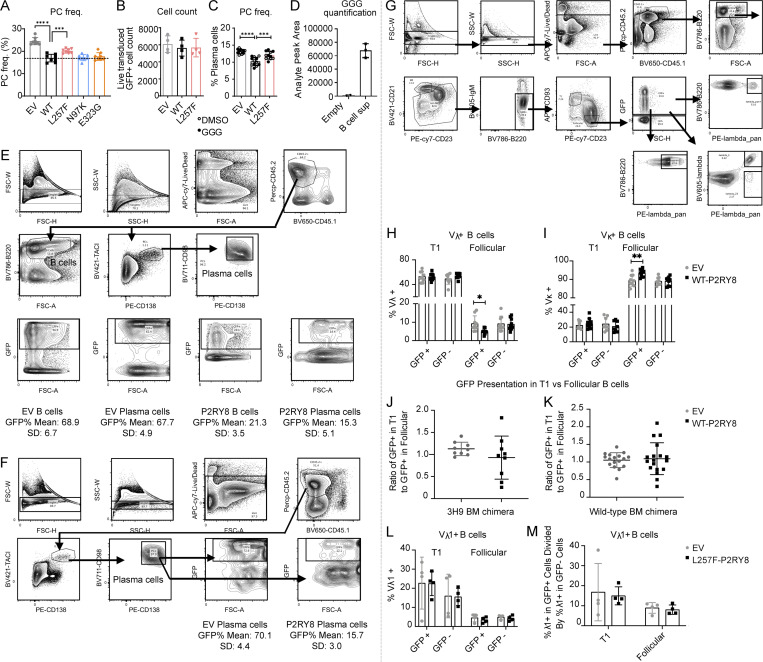
Figure S5.
P2RY8 restrains plasma cell formation and enforces B cell–negative selection. (A–D) Purified splenic B cells were activated with LPS for 24 h and then transduced with retroviruses encoding WT-P2RY8 or mutants. (A) Summary graph showing the frequency of CD138+ plasma cells in indicated retrovirally transduced B cells (n = 8 for each group). (B) Summary graph showing the total number of live GFP+ cells 2 d after transduction (n = 4 for each group). (C) Summary graph showing the frequency of CD138+ plasma cells in B cells retrovirally transduced with WT-P2RY8–WT-IRES-Thy1.1 or mutants. Cultures were treated with vehicle (DMSO, open circles) or GGG (closed circles). (D) Purified splenic B cells were activated with LPS, and GGG levels were measured in the culture supernatant 96 h following activation using LC-MS/MS. Empty refers to LPS-containing media incubated in neighboring wells with no B cells (n = 3). (E and F) Gating strategy and chimerism for plasma cell analysis of spleen and bone marrow (BM) of P2RY8-GFP chimeras. Bone marrow retrovirally transduced with empty vector–IRES-GFP (EV) or WT P2RY8-IRES-GFP was used to reconstitute congenically distinct mice. Spleens (E) and bone marrow (F) were harvested from these mice at 8–12 wk following reconstitution, and GFP+ cell frequencies in B cells and plasma cells were determined by flow cytometric gating. Mean and SD for GFP frequency listed beneath EV and P2RY8 plots. n = 6, with data representative of three independent experiments. (G–M) VH3H9 Tg mouse BM retrovirally transduced with EV-GFP, WT-P2RY8-GFP, or L257F-P2RY8-GFP was used to reconstitute congenically distinct mice. Spleens were harvested from these mice at 9–12 wk following reconstitution, with splenic developmental B cell subsets and Vλ, Vλ1, and Vκ usage determined by flow cytometry. (G) FACS profiles show gating strategy for Vλ, Vλ1, and Vκ analysis of VH3H9 Tg mice. (H and I) Summary graphs of WT-P2RY8-GFP and EV-GFP experimental animals showing frequency of Vλ (H) and Vκ (I) cells within the indicated subsets (n = 9 except for T1:GFP− where n = 8). (J and K) Summary graph showing ratio of total GFP+ cells in the T1 compartment relative to the follicular compartment in the 3H9 BM chimeras (J) and WT BM chimeras (K). (L) Summary graph showing Vλ1 usage in L257F-P2RY8-GFP and EV-GFP animals. (M) Summary graph showing ratio of Vλ usage between GFP+ and GFP− populations in L257F-P2RY8-GFP and EV-GFP animals. GFP− (untransduced) cells serve as an internal control (n = 4). Data were representative of three (E–M) or at least five independent experiments (A–C). P values determined by one-way ANOVA (A and C) or by unpaired two-tailed Student’s test (H–M). *, P < 0.05; **, P < 0.01; ***, P < 0.001; ****, P < 0.0001. Graphs depict mean with SD. freq., frequency; FSC-A, forward scatter-A; FSC-H, forward scatter-H; FSC-W, forward scatter-W; PC, plasma cell; SSC-H, side scatter-H; SSC-W, side scatter-W.

