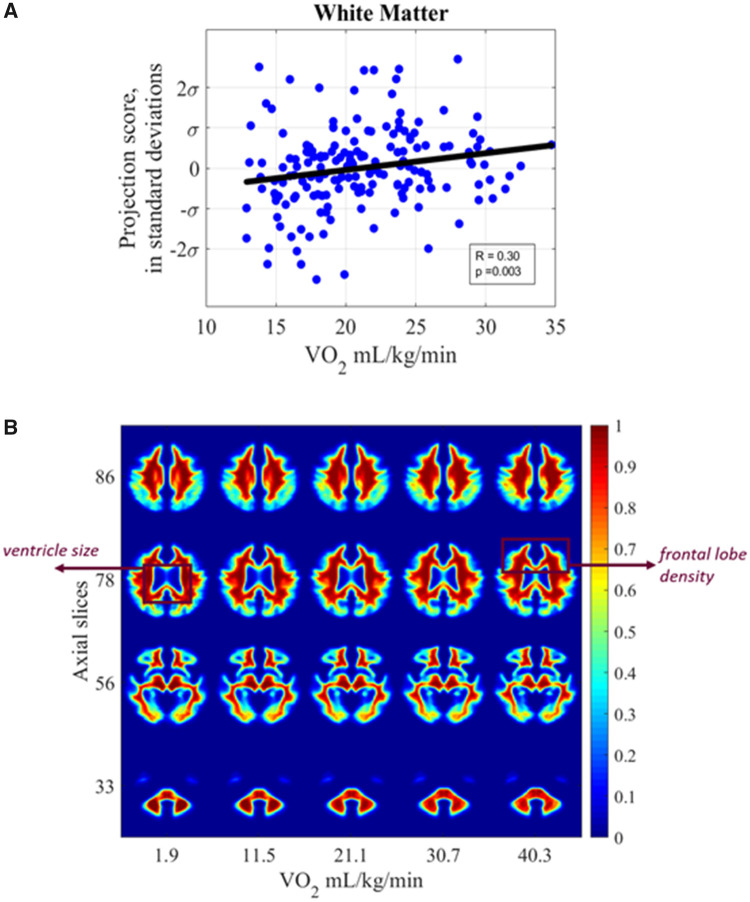
Figure 7.
White matter versus cardiorespiratory fitness. (A) Scatter plot showing relationship between subject peak and white matter distribution with extrapolated ages (B) synthetic images generated by transport-based morphometry directly visualizing the shifts in white matter distribution with peak extrapolated from the study population. The images have been colorized for ease of interpretation. Scale bars correspond to the normalized intensity for each generated 3D image. Select interpolated images in the z-plane are shown that best summarize the differences.

