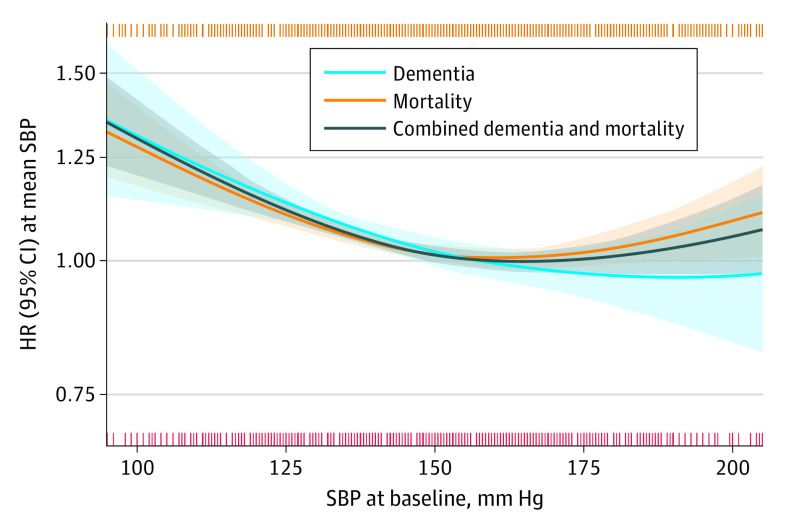
Figure 1. Associations With Dementia, Mortality, and Combined Dementia and Mortality According to Systolic Blood Pressure (SBP) at Baseline.
The lines indicate relative hazard ratios (HRs); shaded areas, 95% CIs; orange vertical stripes (top), 1 or multiple mortality cases at that specific SBP; red vertical stripes (bottom), 1 or multiple dementia cases at that specific SBP. The y-axis denotes that the HR is 1.00 at the mean SBP. Models were fitted using natural splines, with degrees of freedom that were selected from 1 (linear model) to a maximum of 4 (knots at 25th, 50th, and 75th percentile), based on the optimal model fit according to the Akaike information criterion. Models were adjusted for sex and antihypertensive medication use.

