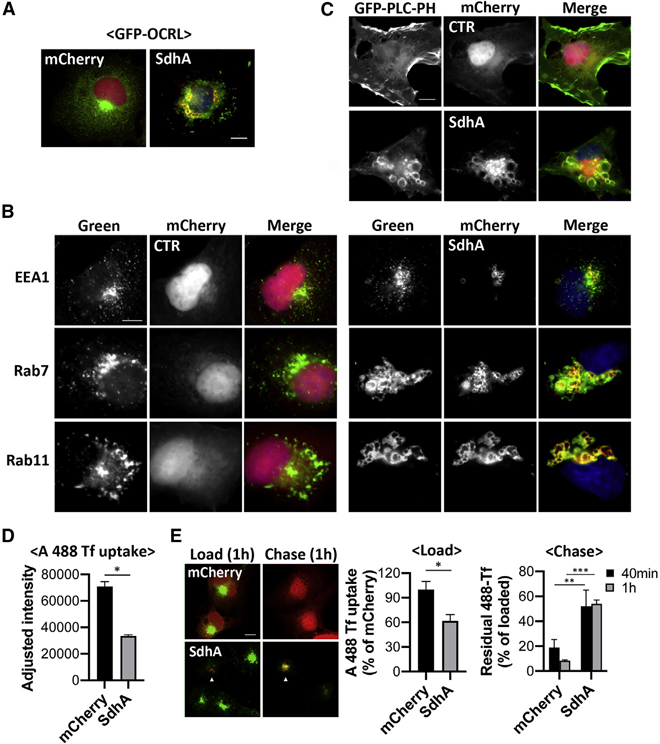
Figure 4. SdhA overexpression phenocopies loss of OCRL function.
(A) Representative micrographs of fixed COS-7 cells co-expressing mCherry-SdhA (red) and GFP-OCRL (green). DNA labeled by Hoechst stain (blue; scale bar, 10 μm). See also Figure S2.
(B) mCherry-SdhA localizes to endocytic vesicles, resulting in enlarged compartments. COS-7 cells expressing mCherry-SdhA (right panel) or mCherry (CTR, left panel) were either immunostained for EEA1 (green) or transfected with GFP-Rab7 or YFP-Rab11 (green). DNA labeled with Hoechst is shown (blue). Scale bar, 10 μm.
(C) COS-7 cells co-expressing mCherry-SdhA and GFP-PLCδ-PH. Scale bar, 10 μm. Additional images are in Figure S3.
(D and E) SdhA impairs endocytosis (D) and recycling of Tf (E). COS-7 cells were transfected with indicated expression vectors, mCherry, or mCherry-SdhA. At 24 h after transfection, cells were incubated with Alexa 488-Tf.
(D) Uptake of Tf was measured as mean fluorescence intensities at 15 min.
(E) For Tf recycling, the cells were loaded with Tf for 1 h at 37°C (load) and chased in complete medium for 40 and 60 min (chase). Arrows indicate SdhA-transfected cells. The fluorescence intensity remaining in cell was quantified and expressed as percentages of the loaded Tf.
(D and E) Data are mean values ± SD (25 cells per replicate), experiments performed in biological triplicate (*p < 0.05; **p < 0.01; ***p < 0.001; unpaired two-tailed Student’s t test). Scale bar represents 10 μm.
Linked to Figures S2 and S3.

