Figure 2.
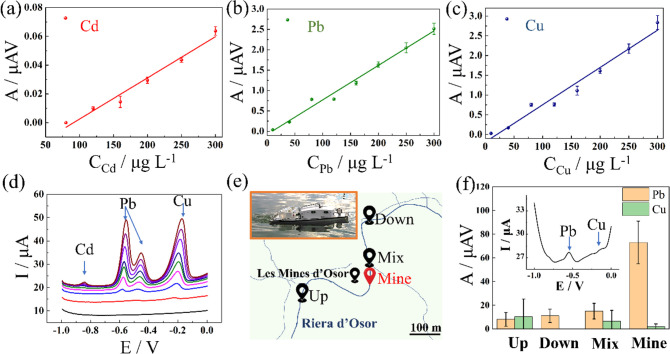
(a–c) Plots of peak area vs concentration in simultaneous measurements for Cd, Pb, and Cu, respectively, in a spiked river sample in the laboratory. (d) Corresponding stripping voltammograms of the simultaneous measurements in a spiked river sample in the laboratory. (e) Schematic illustration of the boat navigating in a campaign experiment. The inset shows a digital photograph of the boat navigating in a river. (f) Determination of Pb and Cu in a campaign experiment. The inset shows a voltammogram obtained in a mine effluent sample, in which a Pb peak centered at −0.5 V can be clearly distinguished.

