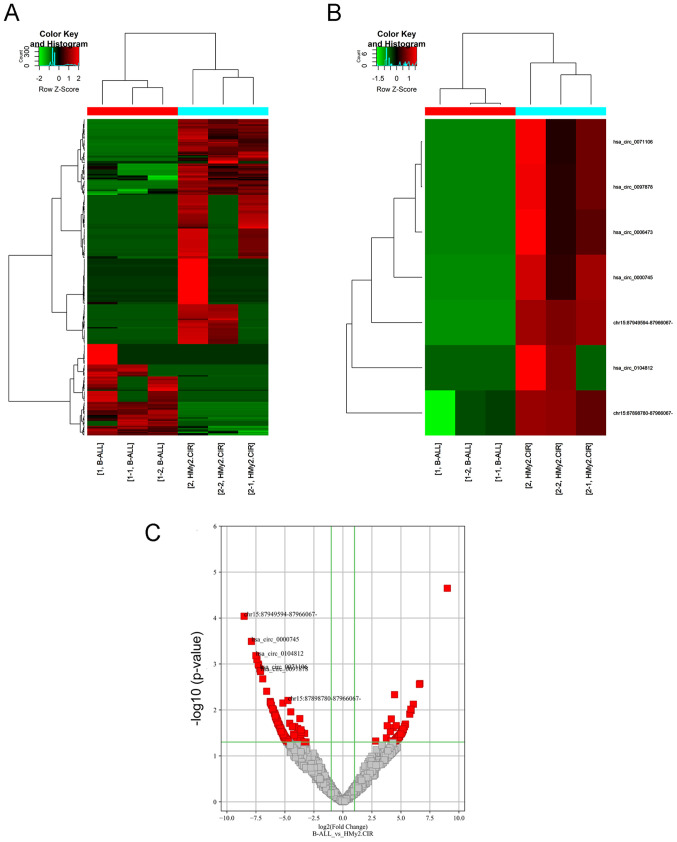
Figure 1.
circRNA expression profiles in Ball-1 and HMy2.CIR cells. (A) Clustered heatmap for differentially expressed circRNAs. (B) Clustered heatmap for the seven selected differentially expressed circRNAs (labeled). (C) Volcano plot. Vertical green lines correspond to 2-fold upregulation and downregulation, while the horizontal green line represents P<0.05. Red dots represent significantly differentially expressed circRNAs. These gray dots represent differentially expressed circRNAs that were not significant. circRNA, circular RNA; B-ALL, acute B-lymphocytic leukemia.

