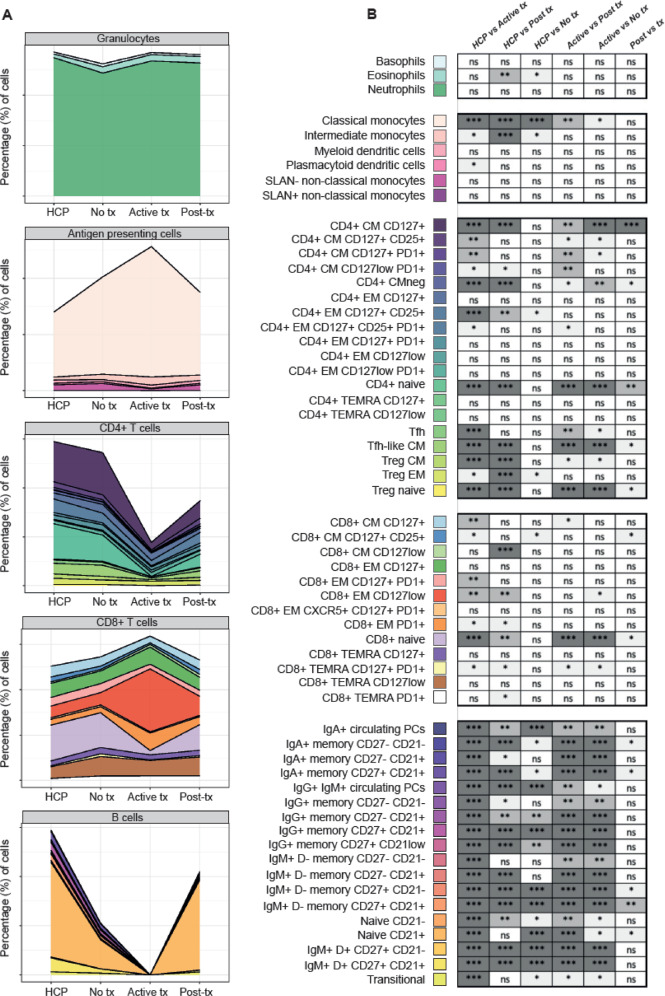
Fig. 3. Tumor-related immune dysregulation and therapy-related immunosuppression.
A Relative distribution of granulocytes, antigen-presenting cells (APC), CD4 and CD8 T cells, and B cells across health care practitioners (HCPs), hematological patients that had never received treatment (No tx, N = 17), those that were on (Active tx, N = 17), and patients that were off-treatment (Post-tx, N = 49) before vaccination. B Statistical significance of differences across groups (with graphical representation of such differences in Supplemental Fig. 3). APC, antigen-presenting cells; CM, central memory; EM, effector memory; Treg, T regulatory cells; Tfh, T follicular-like; TEMRA, terminally effector memory CD45RA+; PC, plasma cells. *P < 0.05; **P < 0.01; ***P < 0.001; n.s., not significant.

