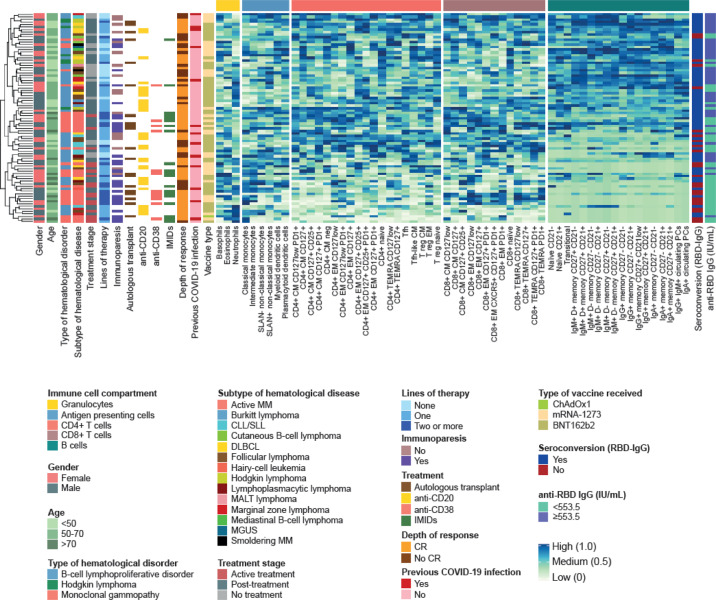
Fig. 5. Immunotypes associated with poor antibody response.
Unsupervised clustering of 83 hematological patients and 102 health care practitioners (HCPs) based on the relative percentile distribution of 59 immune cell types in peripheral blood before vaccination, categorized into four groups: granulocytes, antigen-presenting cell (APC) subsets, T-cell and B-cell subsets. For the columns to the left of the cell-percentage data, moving from left to right, rows are color-coded according to gender, age groups, type and subtype of hematological malignancy, treatment status, number of previous lines of therapy, immunoparesis, autologous transplant, treatment with anti-CD20 antibodies, anti-CD38 antibodies and immunomodulatory drugs (IMiDs), depth of response to treatment (complete remission, CR), previous SARS-CoV-2 infection, and vaccine type. For the columns to the right of the cell-percentage data, moving from left to right, rows are color-coded according to seroconversion and presence of ≥553.5 IU/mL IgG against the receptor-binding domain (RBD) of the S-glycoprotein. CM, central memory; EM, effector memory; Treg, T regulatory cells; Tfh, T follicular-like; TEMRA, terminally effector memory CD45RA+; PC, plasma cells.

