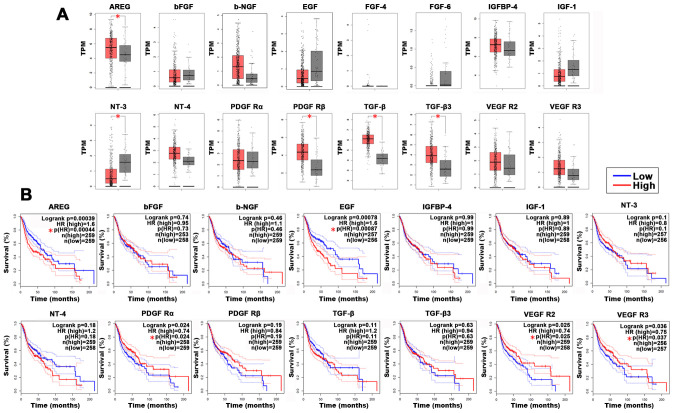
Figure 3.
Association between decreased protein secretion and the clinical features of HNSCC. (A) Box plots indicating mRNA expression levels for candidate genes in HNSCC tissues (red) and normal tissue (gray) for The Cancer Genome Atlas datasets from GEPIA. The y-axes represent transformed log2 (TPM+1). The |log2FC| cutoff was 1 and the P-value cutoff was 0.05. (B) Association between target genes and overall survival was determined using GEPIA. The solid line represents the survival curve and the dashed lines represents the 95% confidence interval. Log-rank P<0.05 was considered to indicate a statistically significant difference. Patients with expression levels higher than the median are indicated by a red line and patients with expression levels lower than the median are indicated by a blue line. *P<0.05. HNSCC, head and neck squamous cell carcinoma; GEPIA, gene expression profile interactive analysis; TPM, transcripts per million; FC, fold change; HR, hazard ratio; b-FGF, basic fibroblast growth factor; b-NGF, beta-nerve growth factor; IGFBP, insulin like growth factor binding protein; IGF, insulin like growth factor; NT, neurotrophin; PDGF R, platelet derived growth factor receptor.

