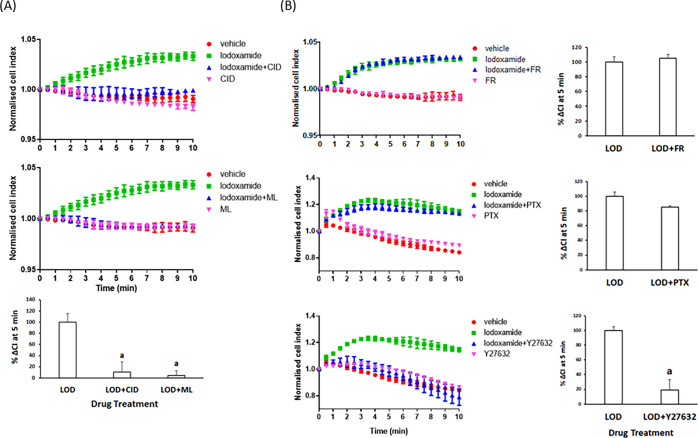
Figure 2.
Cellular impedance measurements confirm the function of GPR35 in HepG2 cells. HepG2 cells cultured in xCELLigence microtitre plate wells were able to measure alterations of electrical impedance over time. (A) Once basal conditions were established, vehicle (red), iodoxamide (green) (upper and middle panels), CID-2745687 (pink) (upper panel), or ML-145 (pink) (middle panel) was added either alone or in combination with lodoxamide (blue) (upper and middle panels) and alterations in the signal measured over time. Lower panel: Difference in the “cell index” measured at 5 min treatment with the effect of lodoxamide presented as 100%. (a) p < 0.05 versus lodoxamide. (B) Various inhibitors of signaling pathways were added (FR = FR900359, 1 × 10⁻⁷ M) (upper panel), PTX = Pertussis toxin, 100 ng/mL (middle panel), and Y27632, 1 × 10⁻⁵ M (lower panel). FR and Y27632 were added 30 min before lodoxamide and PTX 24 h before. Right-hand panels: Difference in the “cell index” measured at 5 min treatment with the effect of lodoxamide presented as 100%. a: p < 0.05 versus lodoxamide.

