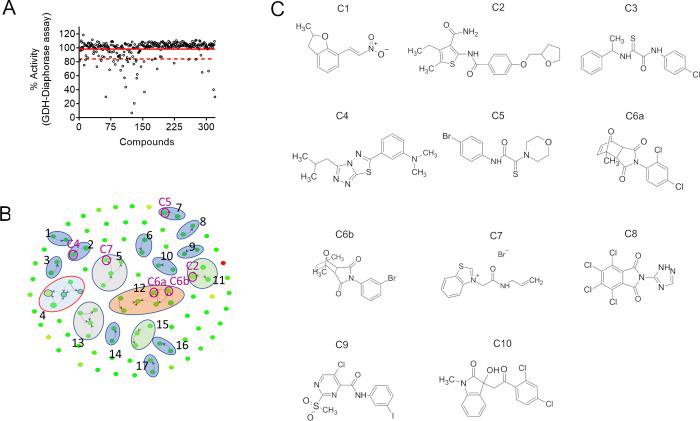
Figure 2.
Orthogonal assay used to eliminate false positives, clusterization of the final hit list, and the 11 further-evaluated compounds. (A) Orthogonal assay (GDH coupled to diaphorase assay) showing the calculated percentage of activity of each well. The solid red line indicates the average % of activity, and the dashed red line indicates 1 standard deviation (SD) of the average. Compounds that inhibited the GDH–diaphorase assay below this limit were considered false positives. (B) Chemical clusterization of the 100 HTS hits. (C) Chemical drawing of the 11 compounds selected for resupplying.

