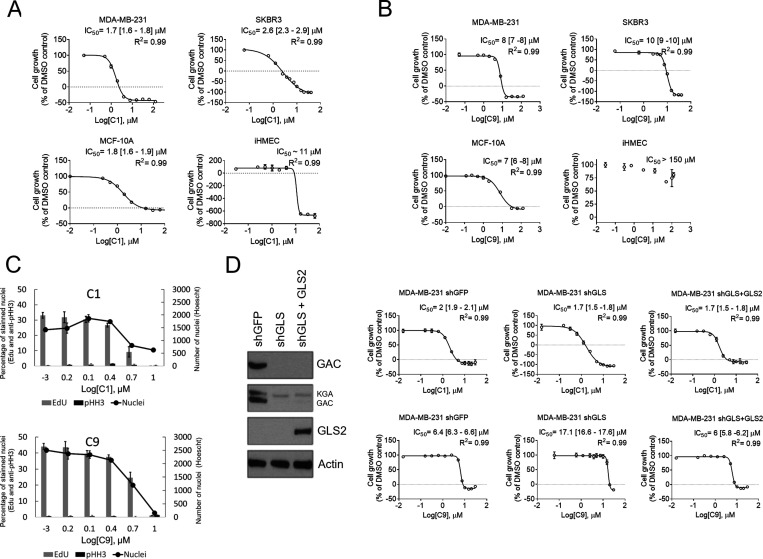
Figure 3.
C1 and C9 effect on tumor and nontumor breast epithelial cell line growth. Growth dose–response assay of C1 (A) and C9 (B) over MDA-MB-231, a TNBC cell line; SKBR3, a non-TNBC cell line; the nontumorigenic MCF-10A cell line; and the hTert-immortalized iHMEC and over MDA-MB-231 shGFP, shGLS, and shGLS expressing GLS2 ectopically subcell lines (D). The value ″0″ was determined based on the number of seeded cells. Doses below the dashed line indicate the concentrations that lead to cell death (the final number of counted cells is smaller than the initial number of cells). IC50 [95% confidence interval] and R2 of the adjusted sigmoidal curve are displayed. (C) Relative number of cells that incorporated EdU and were fluorescently labeled with anti-phosphorylated Ser 25 Histone H3 (anti-pHH3) of MDA-MB-231 treated with C1 (above) or C9 (below). The number of Hoescht-stained nuclei is also displayed. (D, left) Western blot showing GLS knockdown and GLS2 ectopic expression. Graphics in A–D: each bar represents the mean ± SD of n = 4 replicates.

