Figure 5.
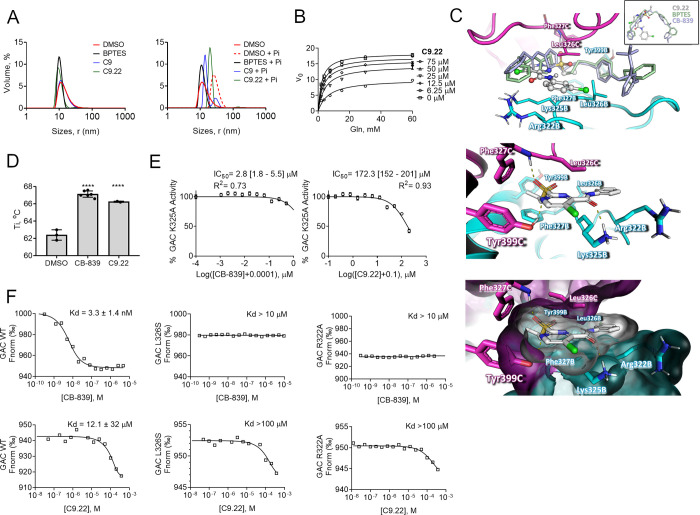
C9.22 is a noncompetitive inhibitor. (A) Dynamic light scattering assay of the BPTES, C9, and C9.22 compounds incubated for 24 h with purified GAC reveals that the compounds do not aggregate the protein in the solution, keeping GAC at a tetrameric state (on the left). The addition of phosphate to the solution drives protein oligomerization to highly active polymers, a phenomenon that is blocked by BPTES (72); C9 and C9.22 incubation led protein to an intermediate state between the polymers and tetramers (on the right). (B) GAC was incubated with increasing concentrations of C9.22; the nonlinear fitting mixed model of inhibition was applied. (C, above) Superposition of the GAC-C9.22 docking model (performed with PDB ID 4JKT shown as a cartoon) on the crystallographic structure of GAC and BPTES (PDB ID 4JKT, light green, only BPTES is shown) and CB-839 (PDB ID 5HL1, light blue, only CB-839 is shown). Insert: BPTES (light green), CB839 (light blue), and C9.22 (gray, ball-and-stick model) superposed crystallographic coordinates. The GAC structure is indicated as cartoon (middle) and surface (below) models. Key residues involved in inhibitor stabilization are indicated as stick models (subunits B and C are indicated as cyan and magenta, respectively). (D) NanoDSF reveals that both CB-839 and C9.22 increase GAC Ti compared to only DMSO. (E) IC50’s of both CB-839 and C9.22 increase when the K325 residue is mutated to an alanine. (F) Thermophoresis shows that up to 10 μM of CB-839 does not bind GAC L326S and R322A mutants (above). CB-839 calculated Kd was 3.3 nM, but this value is an approximation since the protein was assayed at 80 nM. Both L326S and R322A mutations also decrease C9.22 binding affinity (below). Graphs on A display one representative curve out of three replicates. Graph on B: each point represents the mean ± SD of n = 3 replicates. Graph on C: bars represent the mean ± SD; one-way ANOVA was applied, ****p < 0.0001.

