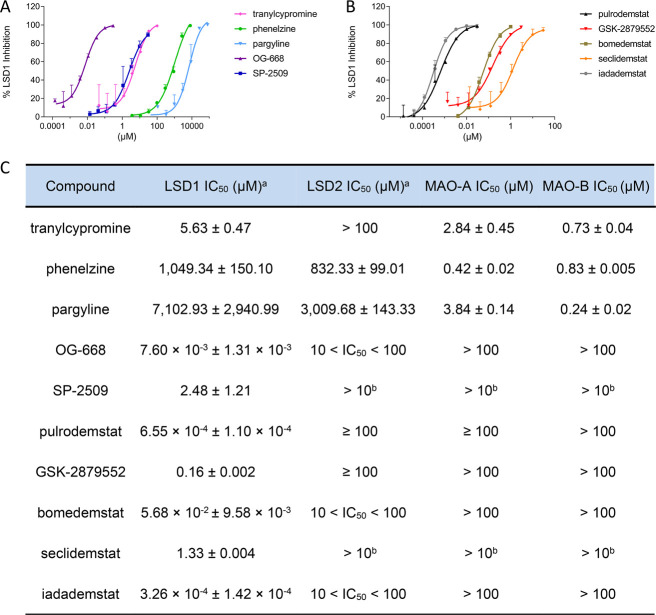
Figure 2.
Biochemical characterization of LSD1 inhibitors. Dose–response curves of LSD1 inhibition for tool compounds (A) and clinical stage inhibitors (B) determined with the HTRF assay. Selectivity of compounds vs other FAD-dependent enzymes (C). aValues obtained with the HTRF assay. bCompound not soluble at 100 μM. Data are represented as mean ± SD of N = 2, n = 2 or 3.

