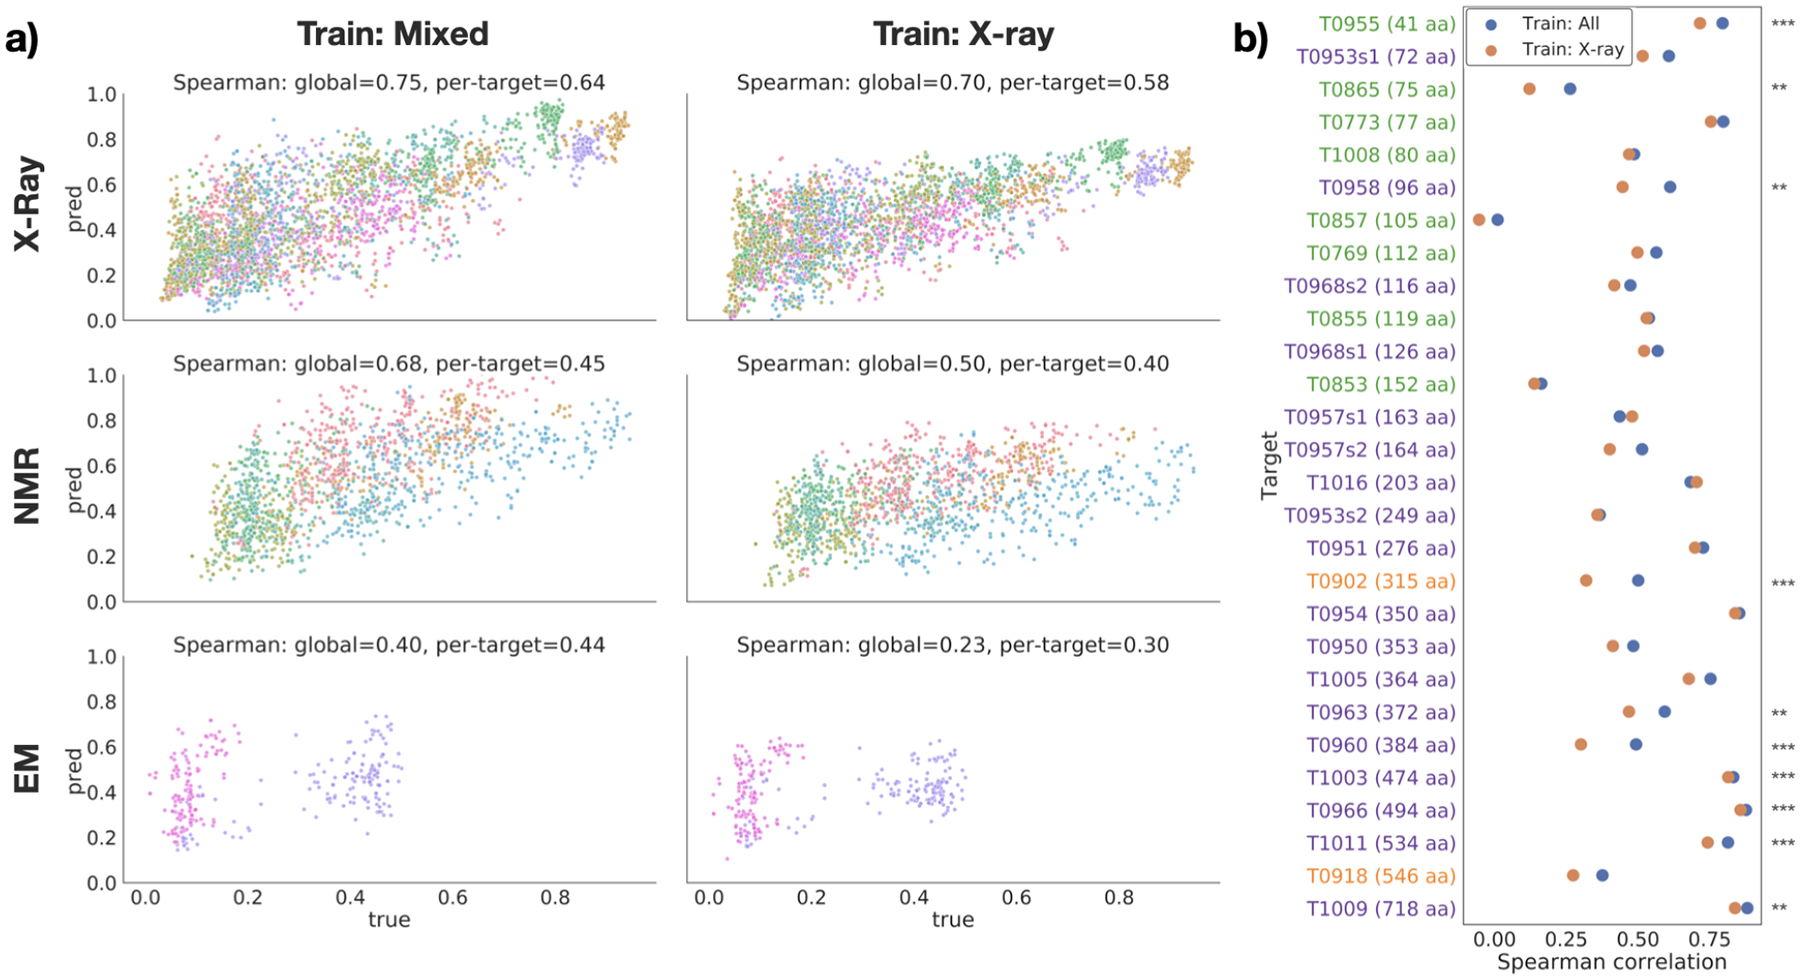
Fig. 2.

Performance on EMA task. (a) True vs. predicted GDT-TS for each target in the test set, divided by experimental method (rows), and training dataset (columns). Points are colored by target protein. (b) Per-target Spearman correlation for models trained on all structures (blue) and X-ray structures only (orange). Targets are sorted by size and colored by experimental method (blue=X-ray; green=NMR; orange=cryo-EM). Stars indicate significance for selected pairs: *** : p < 0.01, ** : p < 0.05, * : p < 0.1 (see Table S1).
