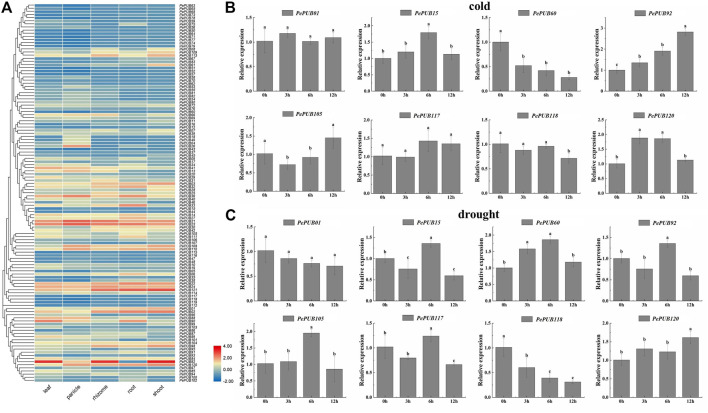
FIGURE 4.
(A) Tissue-specific gene expression patterns of 121 PePUB genes. The expression patterns of 121 PePUB genes in leaf, panicle, rhizome, root, and shoot. The color scale illustrates the log2 (TPM + 1), red and blue colors reveal the high or low transcript abundance, respectively. (B) Expression profiles of eight candidate PePUB genes under low temperature treatment. (C) Expression profiles of eight candidate PePUB genes under drought stress. The values on X axis and Y axis represent the time point (hour) and the relative gene expression levels, respectively. The error strip represents three independent standard deviations (SD). Biological repetition. Different lowercase letters showed significant differences, which were determined by one-way analysis of variance, and then Duncan’s multi-range test (p < 0.05).

