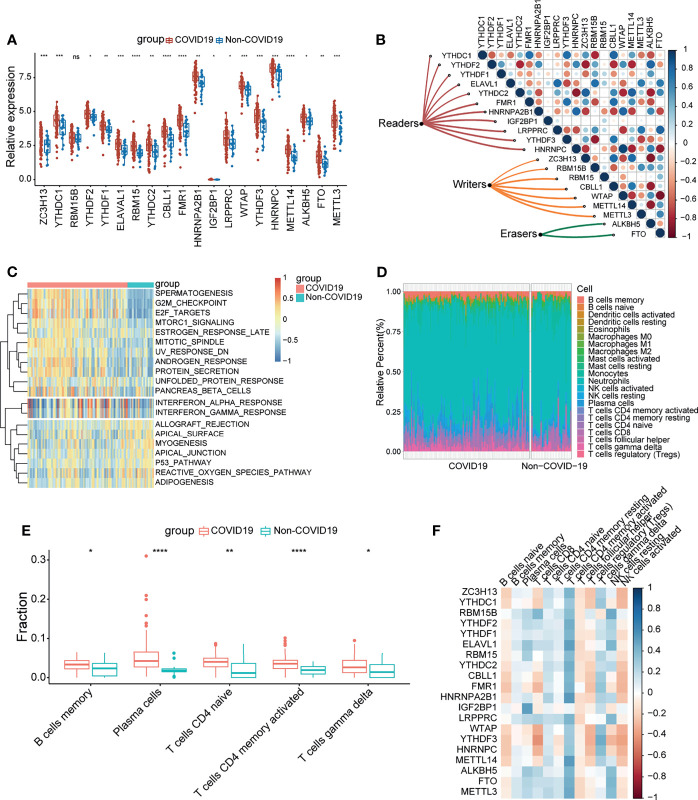
Figure 2.
COVID-19 patients were characterized by upregulated m6A genes and activation of the lymphocytes. (A) The expression of 20 m6A genes of blood leukocytes between patients with or without COVID-19. (B) Correlation plot of 20 m6A genes. The positive correlation was marked with blue, and negative correlation was marked with red. The size of circle represents the absolute value of correlation coefficients. (C) GSVA enrichment analysis showing activated interferon pathways in COVID-19 patients. Red represents high expression, blue represents low expression. (D) The abundance of leukocytes in patients with or without COVID-19. (E) The significant leukocytes fractions in patients with or without COVID-19. (F) The heatmap of correlation between leukocytes and m6A genes. The positive correlation was marked with blue, and negative correlation was marked with red. *p < 0.05, **p < 0.01, ***p < 0.001, ****p < 0.0001, ns, no significance.

