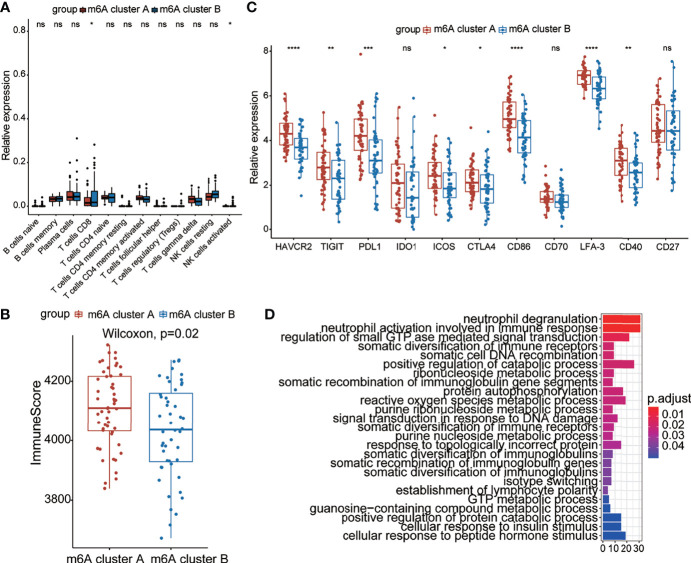
Figure 4.
Immune characteristics between the two m6A clusters. (A) The abundance of leukocytes between the m6A clusters. (B) The immunoscore between the two m6A clusters. (C) Expression levels of immune checkpoint genes between the m6A clusters. (D) The KEGG enrichment analysis based on DEGs of the two clusters. The color bar represents the p values of the pathways. *p < 0.05, **p < 0.01, ***p < 0.001, ****p < 0.0001, ns, no significance.

