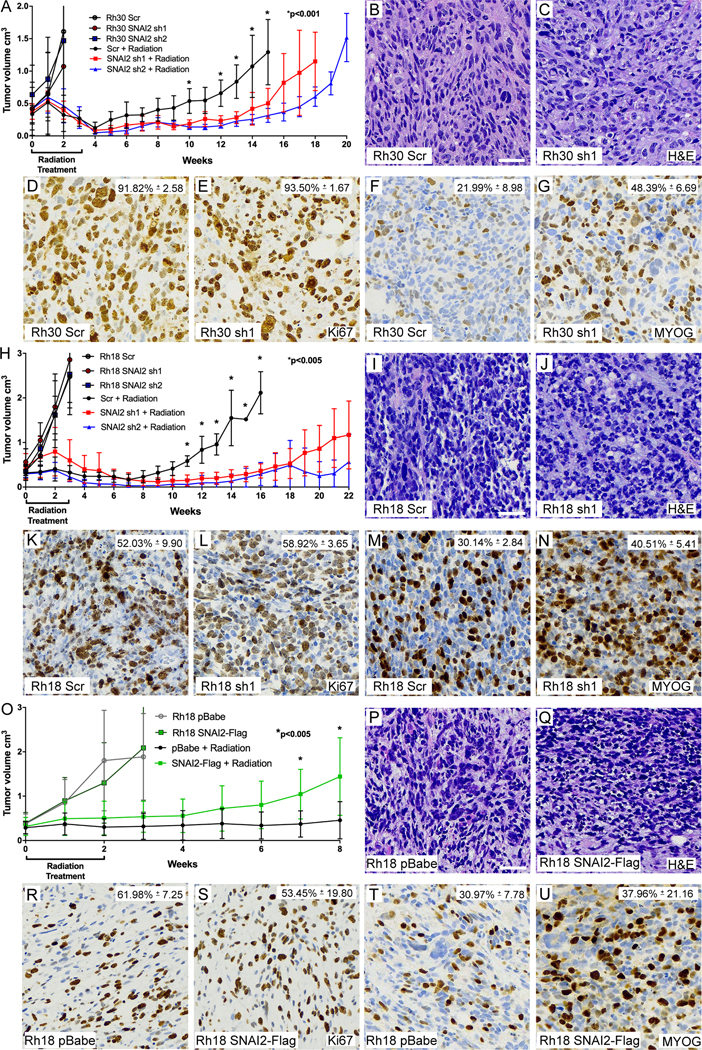
Figure 3. SNAI2 protects RMS tumors from IR in vivo.
A. Growth curves of Rh30 xenografts including Scr shRNA and SNAI2 shRNA 1 and 2 (sh1, sh2) engrafted in mice. Xenograft growth was assessed under no IR and 30 Gy IR treatments. IR was given for 3 weeks at 2 Gy/day, 5 days a week. Error bars represent ±1 SD. *p<0.001 by Student’s t test.
B, C. H&E staining showing histology of Rh30 Scr and SNAI2 knockdown tumor sections. Scale bar = 100 μm.
D-G. Immunohistochemistry analysis of Ki67 (D, E) staining to assess proliferation and Myogenin (MYOG) staining (F, G) in Rh30 xenografts with either Scr shRNA or SNAI2 sh1. Ki67 –Scr vs. sh1 p. MYOG – Rh30 Scr vs. Rh30 sh1 p<0.05 by Welch’s t test. Magnification same as B, C.
H. Growth curves of Rh18 xenografts including Rh18 Scr shRNA and SNAI2 shRNA 1 and 2 (sh1, sh2) engrafted in mice. Xenograft growth was assessed under no IR and 30 Gy IR treatments. IR was given for 3 weeks at 2 Gy/day for 5 days a week. Error bars represent ±1 SD. *p<0.005 by Student’s t test.
I, J. H&E staining showing histology of Rh18 Scr and SNAI2 knockdown tumor sections. Scale bar = 100 μm.
K-N. Immunohistochemistry analysis of Ki67 (K, L) staining to assess proliferation and Myogenin (MYOG) staining (M, N) in Rh18 xenografts with either Scr shRNA or SNAI2 sh1. MYOG – Scr vs. sh1 p=0.0519 by Welch’s t test. Magnification same as I, J.
O. Growth curves of Rh18 xenografts expressing control vector (pBabe) and SNAI2-Flag engrafted in mice. Xenograft growth was assessed under no IR and 20 Gy IR treatments. IR was given for 2 weeks at 2 Gy/day for 5 days a week. Error bars represent ±1 SD. *p<0.005 by Student’s t test.
P, Q. H&E staining showing histology of Rh18 pBabe and SNAI2-Flag tumor sections. Scale bar = 100 μm.
R-U. Immunohistochemistry analysis of Ki67 (R, S) staining to assess proliferation and Myogenin (MYOG) staining (T, U) in Rh18 xenografts with either pBabe or SNAI2-Flag expression. Ki67 – pBabe vs. SNAI2-Flag not significantly different. MYOG – pBabe vs. SNAI2-Flag p=0.0519 by Welch’s t test. Magnification same as P, Q.

