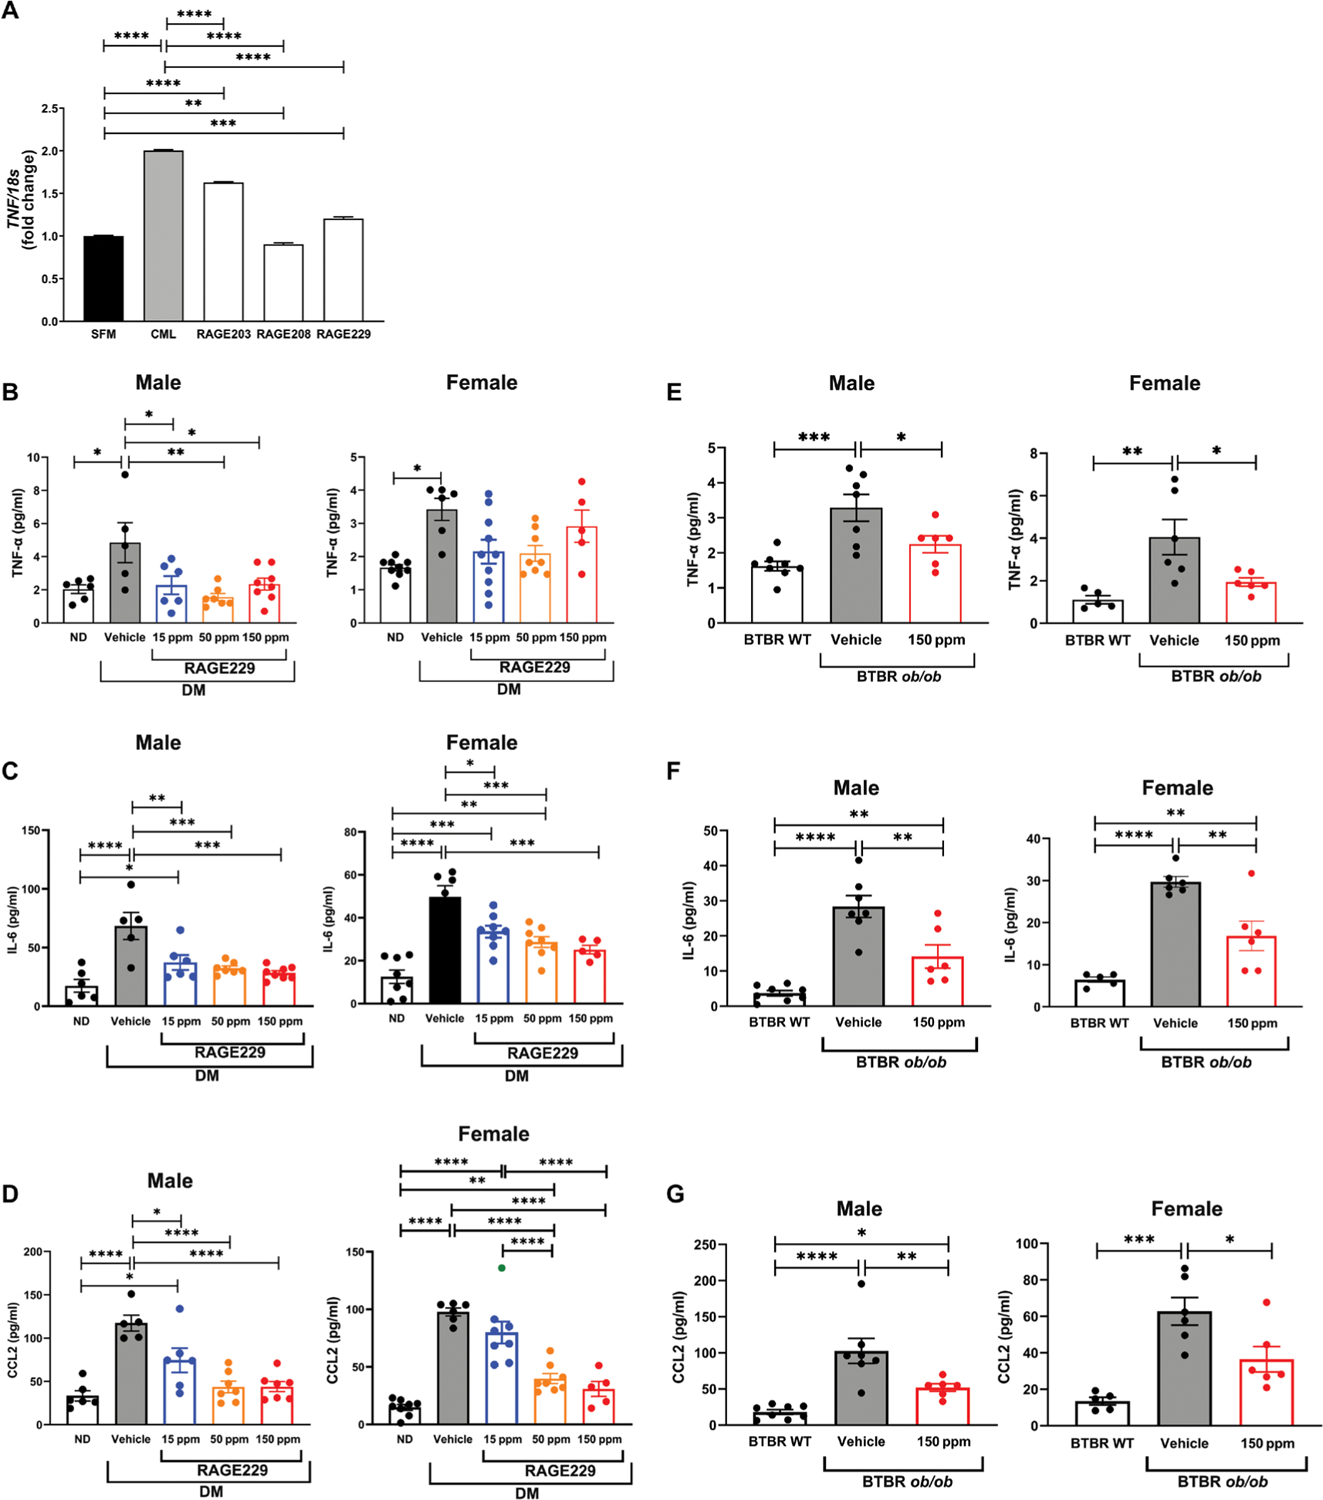
Fig. 8. Effect of RAGE229 on TNF gene expression in THP1 cells and plasma TNF, CCL2, and IL-6 concentrations in mice.

(A) Gene expression of TNF was determined in human THP1 cells treated with RAGE203, RAGE208, or RAGE229 (1 μM) and CML-AGE. Data are presented as means ± SEM. Data from three independent replicate experiments are shown. Statistical analysis was performed by unpaired t test. (B) Plasma concentrations of TNF-α were measured in male and female C57BL/6J mice at euthanasia. For male mice, statistical significance was determined by ANOVA with post hoc Tukey’s test after passing the Shapiro-Wilk test for normality. For female mice, the data did not pass the Shapiro-Wilk test for normality, and the Wilcoxon rank sum test was used. (C) Plasma concentrations of IL-6 were measured in male and female C57BL/6J mice at euthanasia. For male mice, statistical significance was determined by Welch’s ANOVA, followed by a t test with pooled SD after passing the Shapiro-Wilk test for normality. For female mice, statistical significance was determined by ANOVA with post hoc Tukey’s test after passing the Shapiro-Wilk test for normality. (D) Plasma concentrations of CCL2 were measured in male and female C57BL/6J mice at euthanasia. For male mice, statistical significance was determined by ANOVA with post hoc Tukey’s test after passing the Shapiro-Wilk test for normality. For female mice, Welch’s ANOVA was used, followed by a t test with pooled SD, after passing the Shapiro-Wilk test for normality. (E) Plasma concentrations of TNF-α were measured in male and female BTBR ob/ob mice at euthanasia. For male and female mice, statistical significance was determined by ANOVA with post hoc Tukey’s test after passing the Shapiro-Wilk test for normality. (F) Plasma concentrations of IL-6 were measured in male and female BTBR ob/ob mice at euthanasia. For male and female mice, statistical significance was determined by Welch’s ANOVA with post hoc t test with pooled SD test after passing the Shapiro-Wilk test for normality. (G) Plasma concentrations of CCL2 were measured in male and female BTBR ob/ob mice at euthanasia. For male mice, statistical significance was determined by Welch’s ANOVA with post hoc t test with pooled SD test after passing the Shapiro-Wilk test for normality. For female mice, statistical significance was determined by ANOVA with post hoc Tukey’s test after passing the Shapiro-Wilk test for normality. The number of mice per group is indicated in each figure. Data are presented as means ± SEM. *P < 0.05, **P < 0.01, ***P < 0.001, and ****P < 0.0001.
