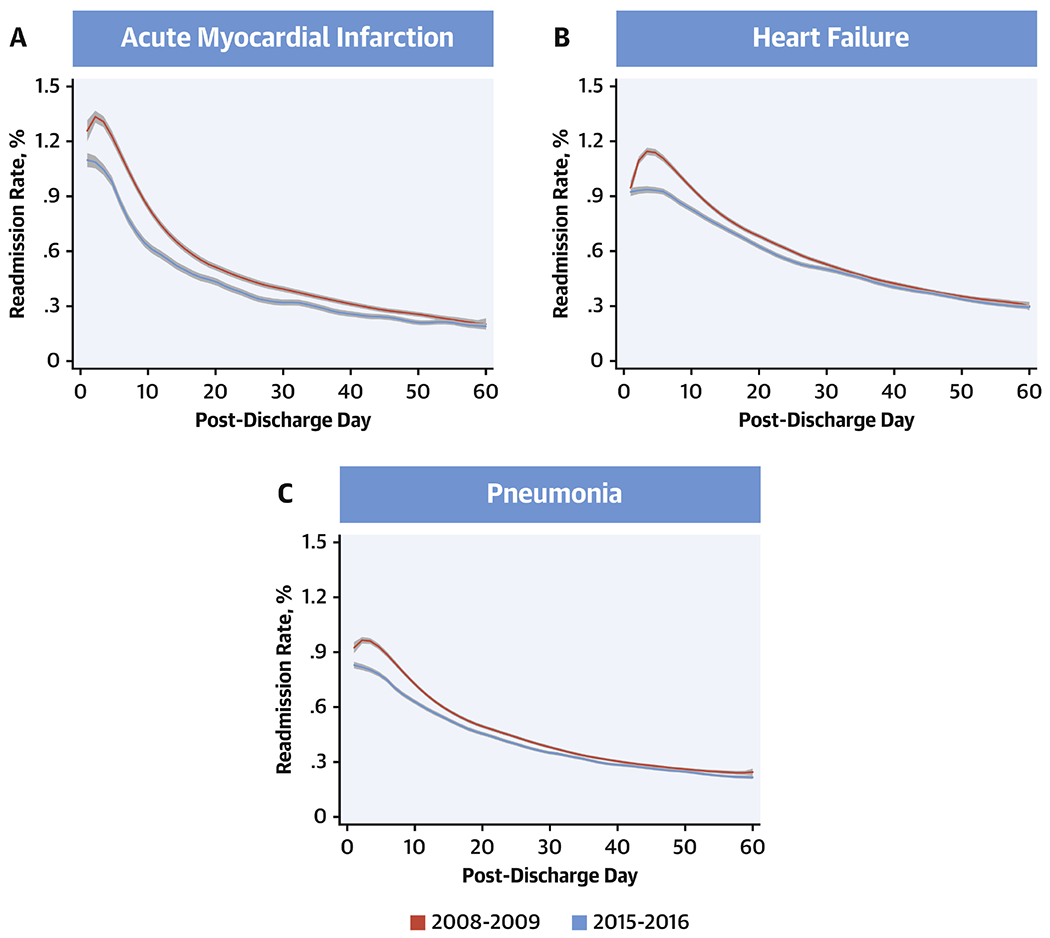
Figure 1: All-cause Readmission Rates from Day 1 Through 60 Post-Discharge.

Readmission rates from days 1 through 60 post-discharge during the first year (July 2008-June 2009) and final year (July 2015-June 2016) of the study. Lines represent the smooth curves based on generalized additive models with a fourth order polynomial. Red: 2008-09, blue: 2015-16.
