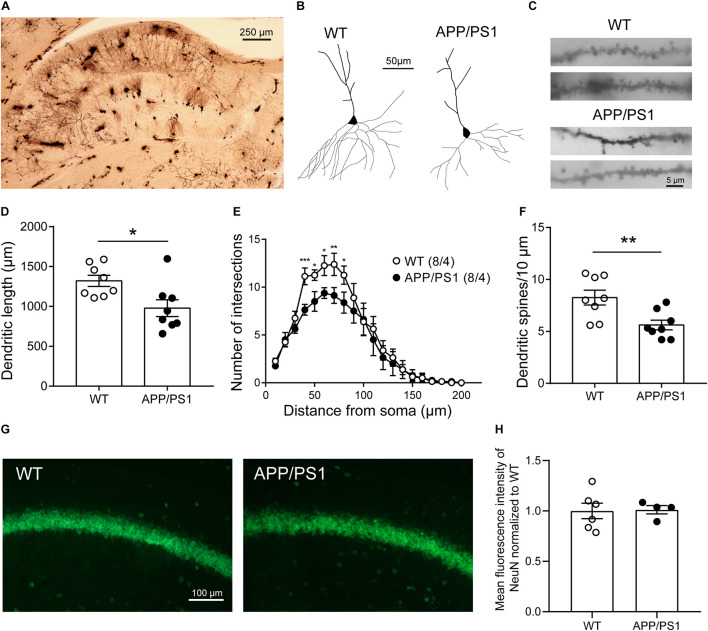
FIGURE 5.
The morphology and number of pyramidal neurons in the CA1 of 8-month-old APP/PS1 mice. (A) Golgi-Cox staining of brain tissue samples. Scale bar, 250 μm. (B) Representative examples of reconstructed pyramidal neurons in the CA1 of 8-month-old WT and APP/PS1 mice. Scale bar, 50 μm. (C) Representative spine morphology of pyramidal neurons in WT and APP/PS1 mice. Scale bar, 5 μm. (D) The dendritic length of pyramidal neurons was decreased in APP/PS1 mice compared with WT mice (n = 8 from 4 mice; *p < 0.05, unpaired t-test). (E) The complexity of dendrites of pyramidal neurons was decreased in APP/PS1 mice compared with WT mice (interaction: ***p < 0.001; two-way repeated-measures ANOVA followed by Bonferroni’s post hoc test, *p < 0.05, **p < 0.01, ***p < 0.001). (F) The total dendritic spine density of pyramidal neurons was decreased in APP/PS1 mice compared with WT mice (n = 8 from 4 mice; **p < 0.01, unpaired t-test). (G) Representative images of NeuN staining of the hippocampal CA1 area of 8-month-old APP/PS1 and WT mice. Scale bar: 100 μm. (H) The quantitative results of the mean fluorescence intensity of NeuN were not altered significantly between 8-month-old APP/PS1 and WT mice (n = 4–6 mice/group).

