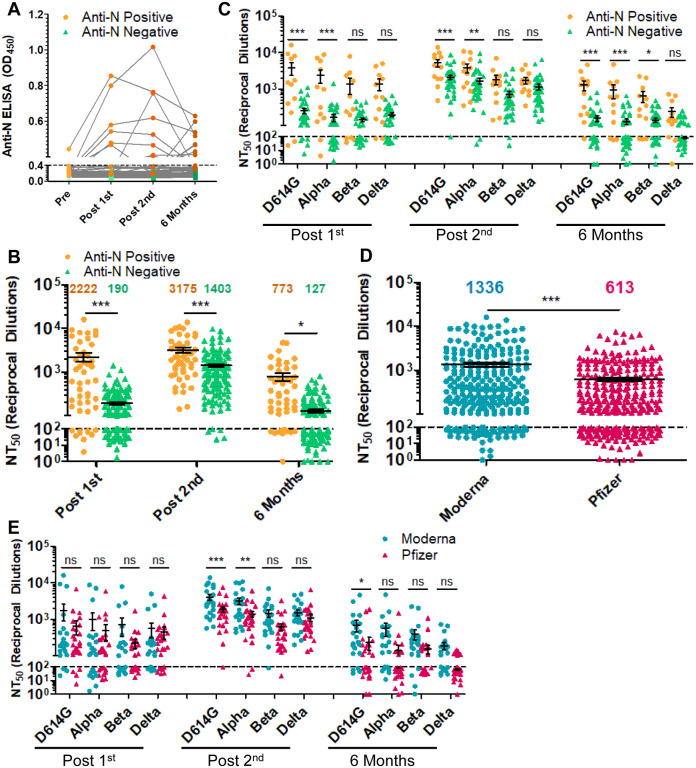
Figure 2: The durability of the nAb response is dependent on prior COVID-19 status, mRNA vaccine type but not age.
(A) Anti-N ELISA results are presented for HCWs who became anti-N positive (OD450 > 0.4 at any time point; n = 12) and HCWs who never became anti-N positive (OD450 < 0.4 for all time points; n = 36). (B, C) HCWs were divided by prior COVID-19 status as determined by anti-SARS-CoV-2 N ELISA. HCWs with anti-N above the cut-off value of 0.4 for any time point (n = 12) were considered as COVID-19 positive during the study period. NT50 values against all four variants combined (B) or separated (C) for anti-N positive HCWs are compared to anti-N negative HCWs for samples collected post first mRNA vaccine dose, post second mRNA vaccine dose, and six months post second mRNA vaccine dose, respectively. (D, E) HCWs were divided by types of mRNA vaccine received, either Moderna mRNA-1273 (n = 22) or Pfizer/BioNTech BNT162b2 (n = 26), and all variants at post-first vaccine dose, post-second vaccine dose, and six months post-second vaccine doses were plotted together (D) or grouped by variant and time point (E). Mean NT50 values are indicated at the top of plots (B, D) Statistical significance was determined by one-way ANOVA with Bonferroni’s correction (B) two-way, repeated measures ANOVA with Bonferroni’s correction (C, E) or unpaired two-tailed t-test with Welch’s correction (D). In call cases, *p < 0.05; **p < 0.01; ***p < 0.001; ns: not significant.

