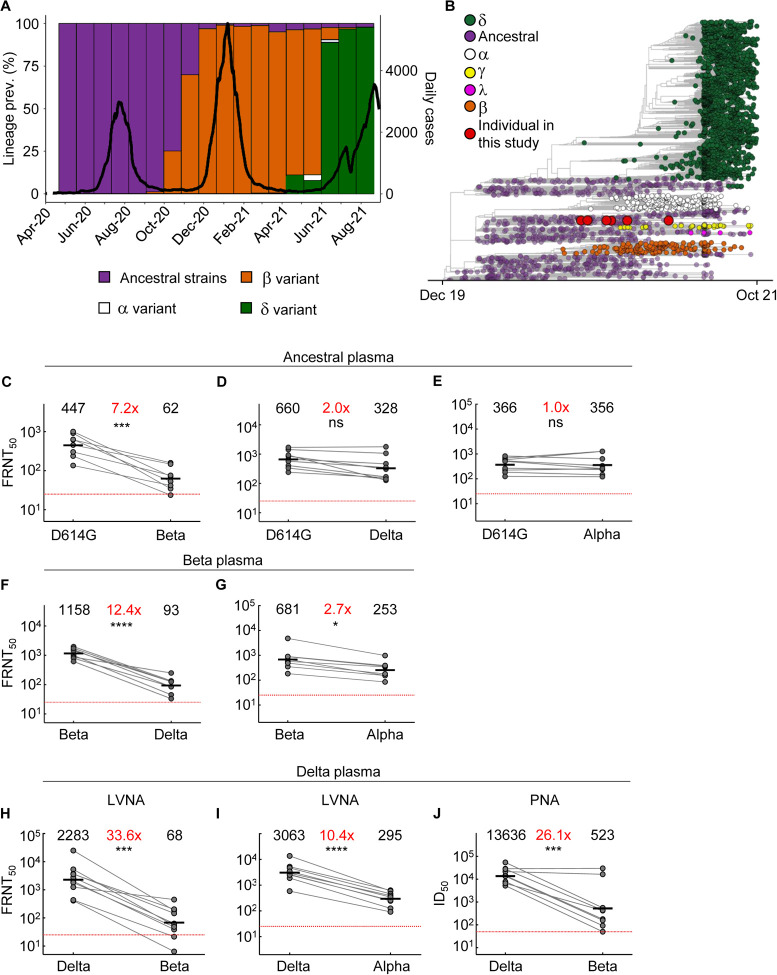
Figure 1: Neutralization distance between variants.
(A) Infection waves and variant frequencies in South Africa. (B) Maximum-likelihood phylogenetic tree with evolved virus sequences (red) at 6 time-points in relation to 3883 global sequences with variants shown. (C-E) Neutralization of the Beta (C), Delta (D) and Alpha (E) virus compared to D614G ancestral virus by plasma from convalescent participants infected by ancestral strains (n=8). (F-G) Neutralization of the Delta (F) and Alpha (G) compared to Beta virus by plasma from Beta infections (n=9). (H-I) Neutralization of the Beta (H) and Alpha (I) compared to Delta virus by plasma from Delta infections (n=10). Experiments presented in panels C-I performed by a live virus neutralization assay (LVNA). (J) Neutralization of Beta compared to Delta virus same plasma as (I) using a pseudo-virus neutralization assay (PNA). Red horizontal line denotes most concentrated plasma tested. Numbers in black above each virus strain are geometric mean titers (GMT) of the reciprocal plasma dilution (FRNT50 for LVNA, ID50 for PNA) for 50% neutralization. Numbers in red denote fold-change in GMT between virus strain on the left and the virus strain on the right. p-Values are * <0.05–0.01; ** <0.01–0.001; *** < 0.001–0.0001, **** < 0.0001 as determined by the Wilcoxon rank sum test.

