Figure 3.

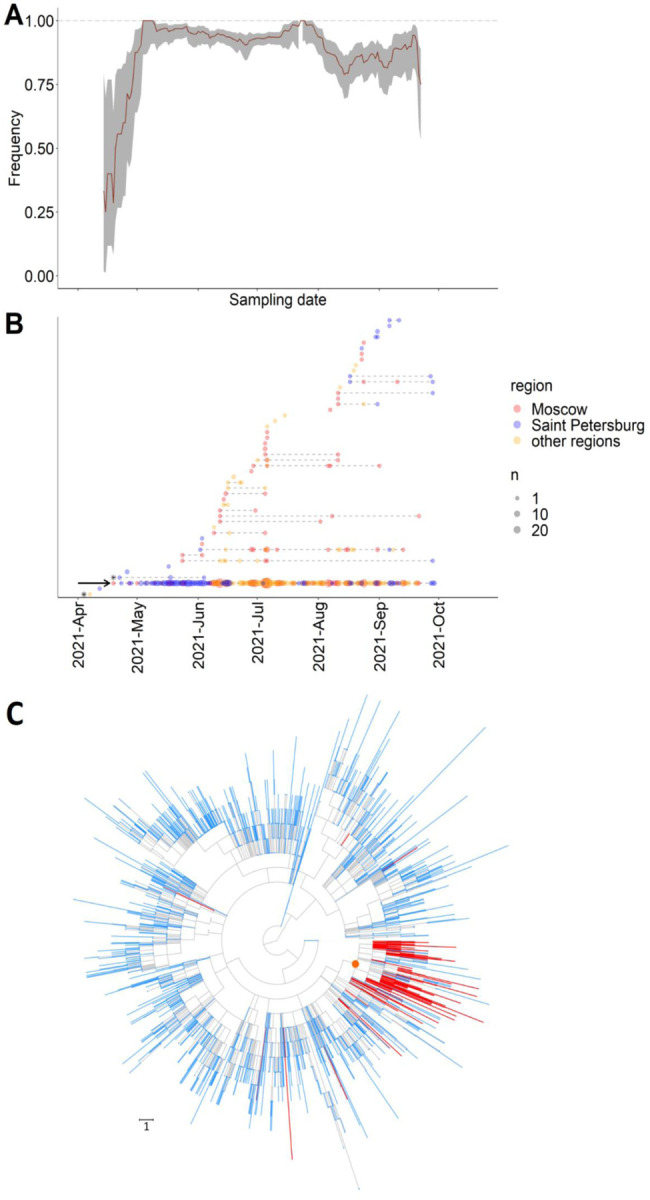
Dynamics of Delta sublineages in Russia. A) The fraction of the nsp2:K81N+ORF7a:P45L combination among all Delta samples from Russia in 15-day sliding window. The confidence band is the 95% binomial confidence interval. B) Timeline for imports of Delta subclades into Russia. Each horizontal line represents a Russian subclade descendant from one import, ordered by the date of the earliest sample. Circles represent samples taken on a particular date; circle size reflects the number of samples; circle color indicates the region of sampling. The AY.122+ORF7a:P45L sublineage is marked by an arrow. The two imports with known travel history are shown as asterisks. C) AY.122+ORF7a:P45L sublineage on the UShER tree of Delta. For visualization purposes, 90% of Russian and 99% of non-russian tips were pruned randomly. An internal node that was defined as the main import and which defines the AY.122+ORF7a:P45L sublineage is marked by an orange circle; Russian samples are colored in red; non-Russian samples are colored in blue; internal branches are colored in grey. Branch lengths are measured in the number of mutations.
