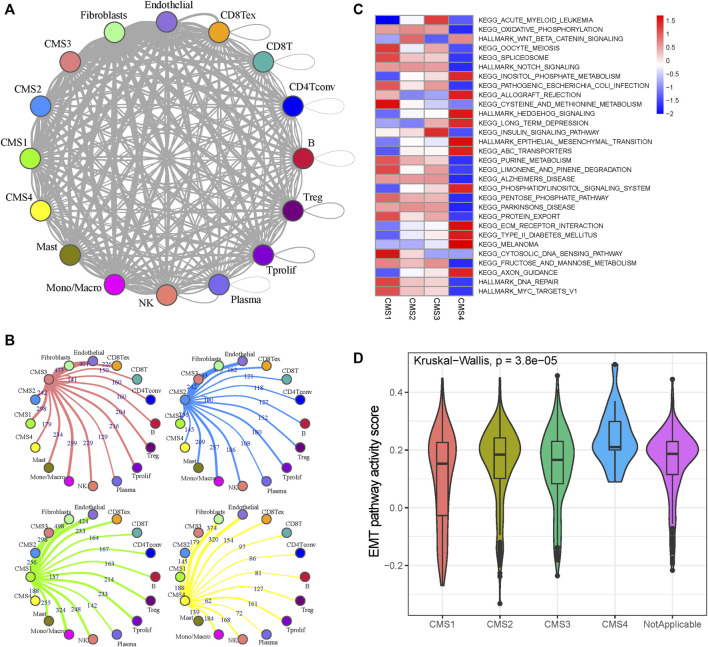
FIGURE 2.
Cell-cell interaction and pathway activity analysis (A) Cell-cell interaction network of different cell types. The node size represents the number of interactions. The width of the edge represents the number of significant ligand-receptor interactions in the 2 cell types (B) Cell-cell interaction network of CMS and other cells (C) Differences in the enrichment of the pathways across the five molecular subtypes (D) Violin plots of GSVA enrichment scores of the EMT pathway of the four molecular subtypes.

