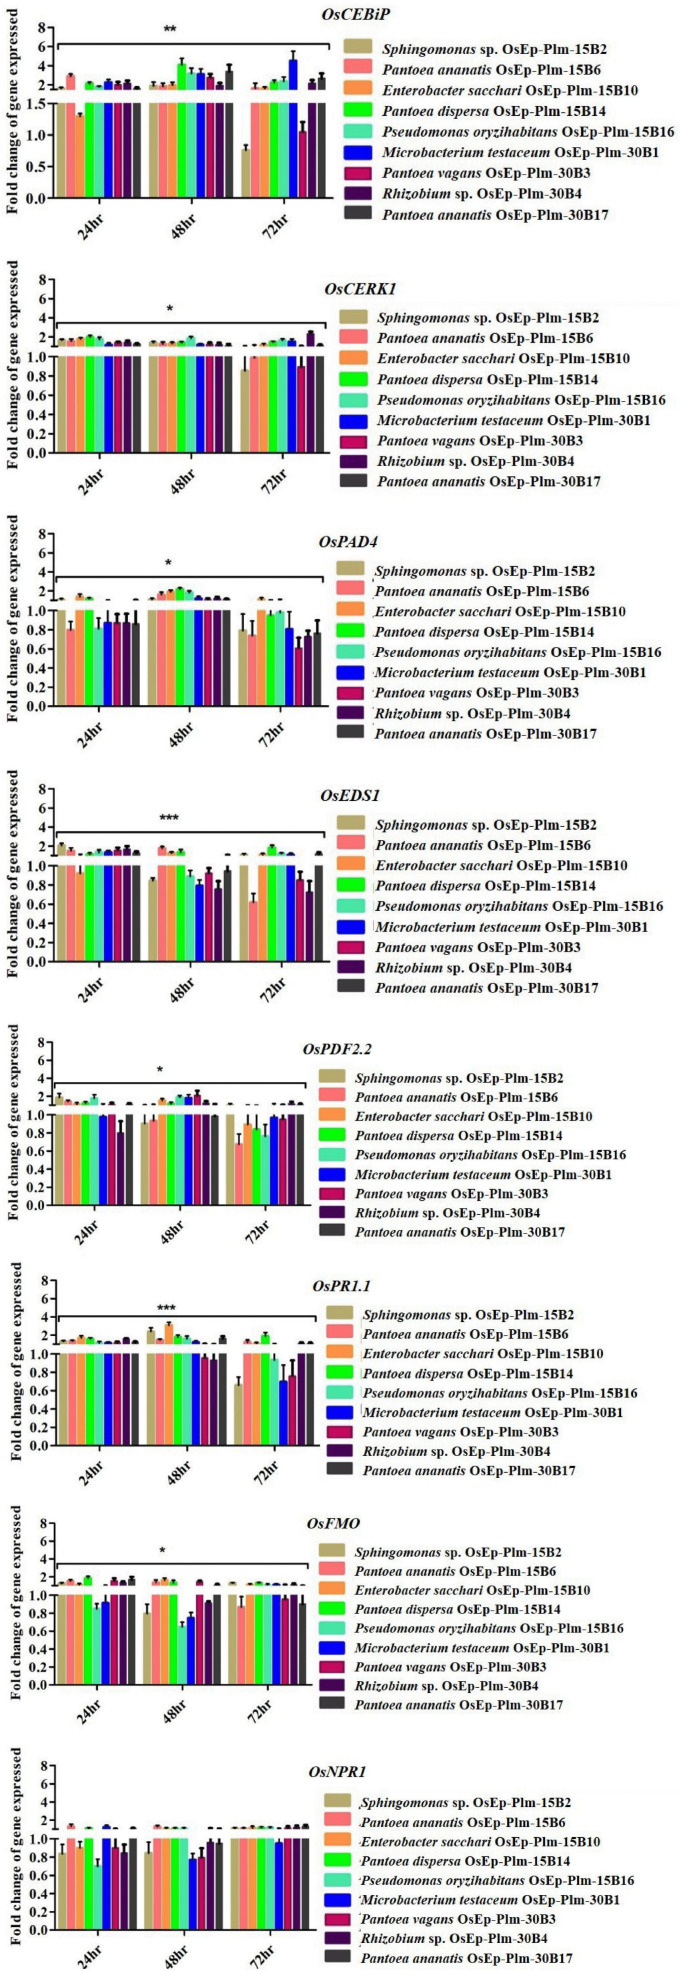
FIGURE 5.
qPCR-based transcriptional analysis of defense gene expression in rice seedlings upon phyllobacterization. The fold change values obtained for the defense genes were imported into the GraphPad Prism program (https://www.graphpad.com/scientific-software/prism), and two-way ANOVA was conducted using Bonferroni post-hoc test for determining the statistical significance at *p ≤ 0.05, **p = 0.001, and ***p = 0.0001. Refer to Supplementary Table 10 for data pertaining to fold changes of gene expression.

