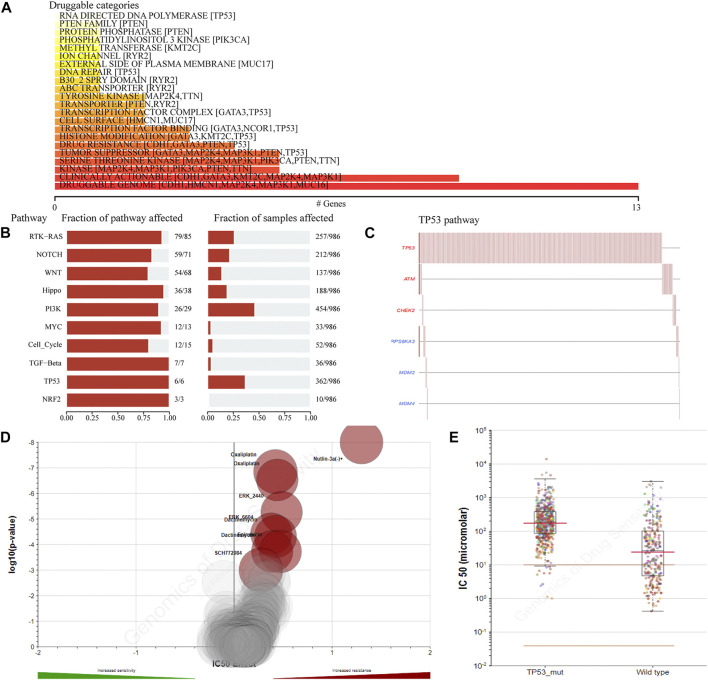
FIGURE 3.
The drug sensitivity caused by TP53 mutation. The relationship between gene mutation level and different kinds of drugs in TCGA-BRCA dataset was analyzed (A); analysis of gene mutation level in different carcinogenic signaling pathways in TCGA-BRCA dataset (B); mutation distribution of six major genes in TP53 signaling pathway in TCGA-BRCA patients (C); the volcano map shows the sensitivity analysis of TP53 gene mutation to different anticancer chemotherapy drugs; the red circle indicates that TP53 gene mutation leads to the decrease of drug sensitivity (D); compared with TP53-wt group, the IC50 value of nutlin-3a (-) in patients with TP53 mutation was significantly higher (E). wt, wild type.

