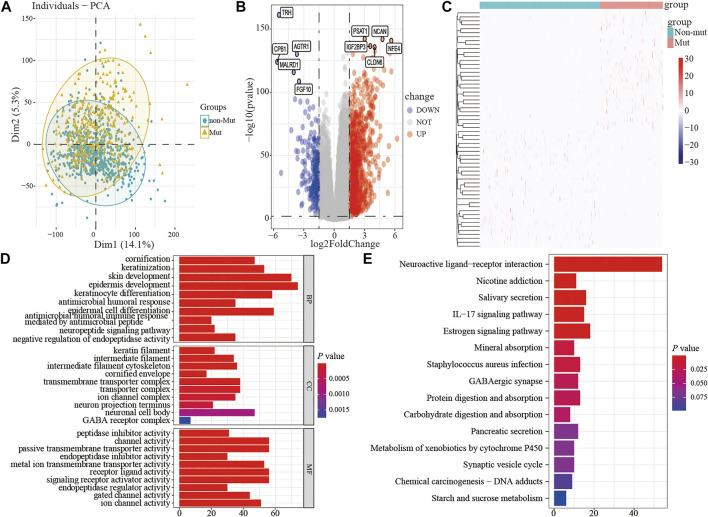
FIGURE 4.
The differential expression and functional enrichment analysis based on TP53 mutation. PCA was performed between the patients with mutation and non-mutation (A); volcano map and heatmap showed the expression of DEGs between TP53-mutation and TP53-wt group (B-C); the results of GO analysis included the cell component (D), biological process (E), and molecular function (F) terms; the results of KEGG analysis that differentially expressed genes were involved in biological related signaling pathways (G). PCA, principal component analysis; wt, wild type.

