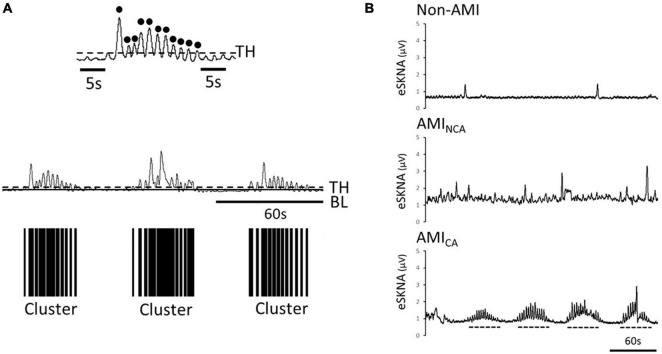
FIGURE 2.
(A) Black dots are the defined bursts, which are the peaks above the threshold. Definition of a cluster, which is defined to contain at least five bursts within 10–60 s and without any bursts before/after the cluster in 5 s. The black bars are the clusters found in the eSKNA. The distribution of the black bars shows the clustering phenomenon. TH, threshold; BL, baseline. (B) Examples of eSKNA in non-AMI, AMINCA, and AMICA showing the morphological difference. The non-AMI group is relatively stable compared to the AMI group that shows sporadic bursts. The AMINCA group has higher variance and irregular bursts. The AMICA group can observe the obvious clustering phenomenon. Dotted lines indicate the clusters.

