FIGURE 3.
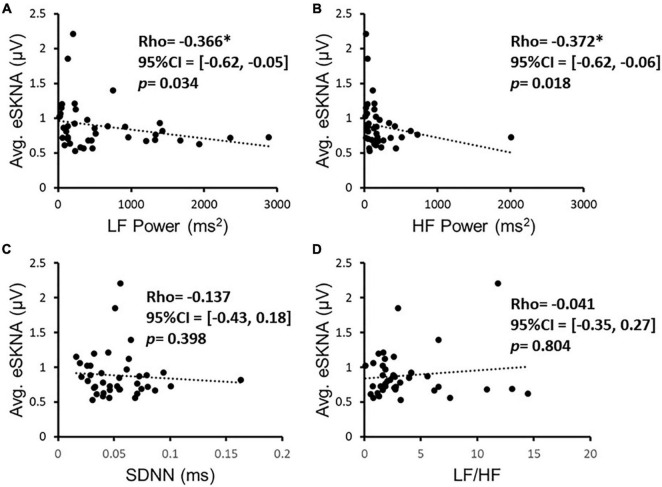
The correlation of eSKNA and the parameters in HRV analysis in 40 study subjects. (A,B) Show the significant correlations between eSKNA and LF power, and eSKNA and HF power, respectively. (C,D) Show no correlation between eSKNA and SDNN, and eSKNA and LF/HF, respectively. *Statistically significant (p < 0.05).

