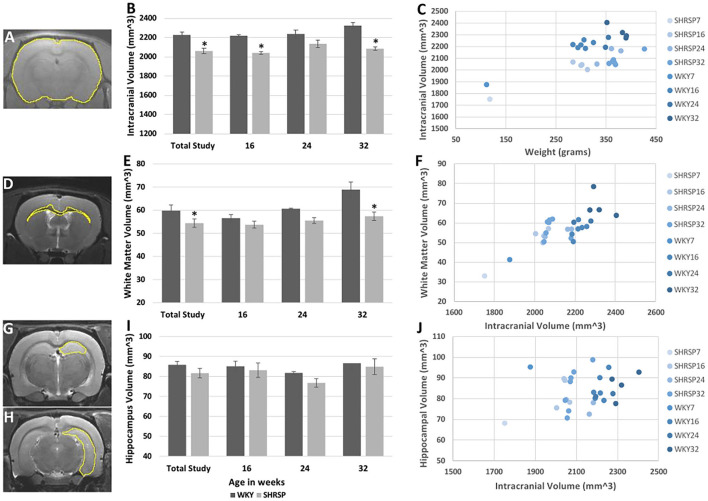
Figure 4.
Volumetric analyses of the intracranial (A–C), white matter (D–F), and hippocampal (G–J) volumes in WKY and SHRSP show smaller volumes in SHRSP compared to WKY. Manual segmentation of one slice is shown on T1 sequence for the intracranial content (A), T2w imaging for the white matter (D), and hippocampus (G,H). The intracranial volume was statistically and significantly smaller in SHRSP compared to WKY in the total study and at the study time points (B). White matter volume was statistically and significantly smaller in SHRSP in both the total cohort and at 32 weeks (E). Finally, while the hippocampal volume was smaller in SHRSP, the difference was not statistically significant (I). Scatter plot presentation of the data is presented in (C), (F), and (J) in which SHRSP and WKY at each time point is presented with a distinct color. Figure (C) shows the difference between SHRSP and WKY using intracranial volume (vertical axis) and weight (horizontal axis). A lesser difference is seen using white matter volume (vertical axis) with intracranial volume on the horizontal axis (F). Finally, animals do not appear to be different according to the hippocampal volume (vertical axis) (J). WKY, Wistar Kyoto Rats; SHRSP, Spontaneously Hypertensive Stroke-Prone Rats; * Statistically significant difference of P < 0.05. Data in (B), (E), and (I) represent the mean and standard error of the mean.

