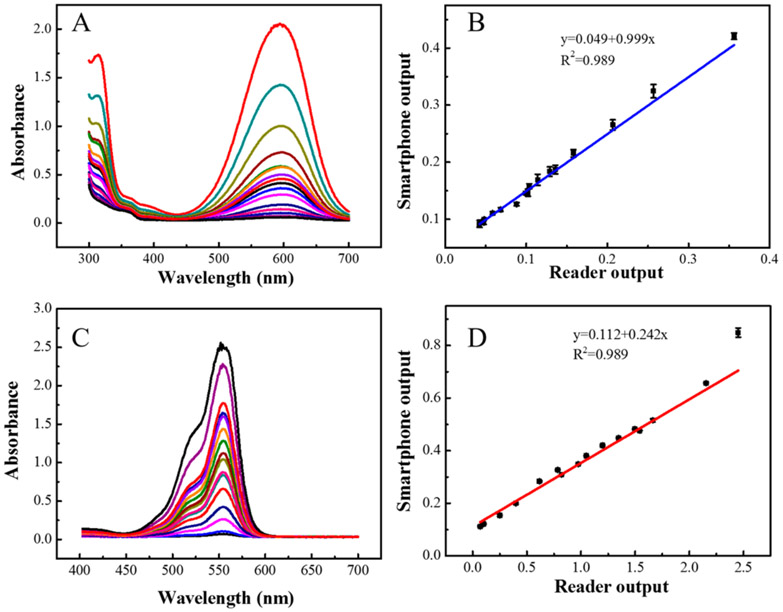
Figure 2.
(A) UV spectrum with different concentrations of methyl blue obtained by a laboratory microplate reader. (B) Correlation of results obtained by laboratory microplate reader and the smartphone single-stripe reader using the red channel. (C) UV spectrum with different concentrations of rhodamine B obtained by a laboratory microplate reader. (D) Correlation of results obtained by using a laboratory microplate reader and the smartphone single-stripe reader using the green channel.

