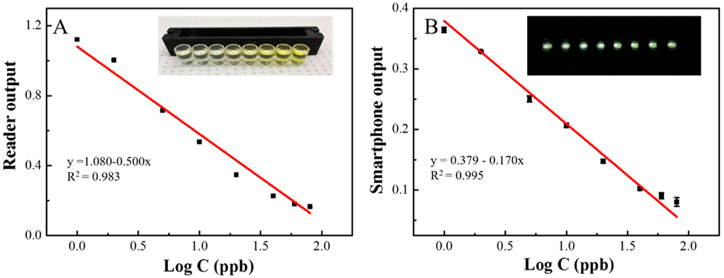
Figure 5.
(A) Linear relationship between microplate reader output vs the logarithm of target concentration. Inset: visual figure of single stripe vs different concentrations of target 2,4-D (B) Linear relationship between smartphone output vs the logarithm of target concentration. Inset: smartphone image of single stripe vs different concentrations of target 2,4-D (from left to right: 80, 60, 40, 20, 10, 5, 2 and 1 ppb).

