
Fig. 4. Age, period, and cohort effects on suicide in the US from 1999 to 2018 by firearm involvement and race, among women.
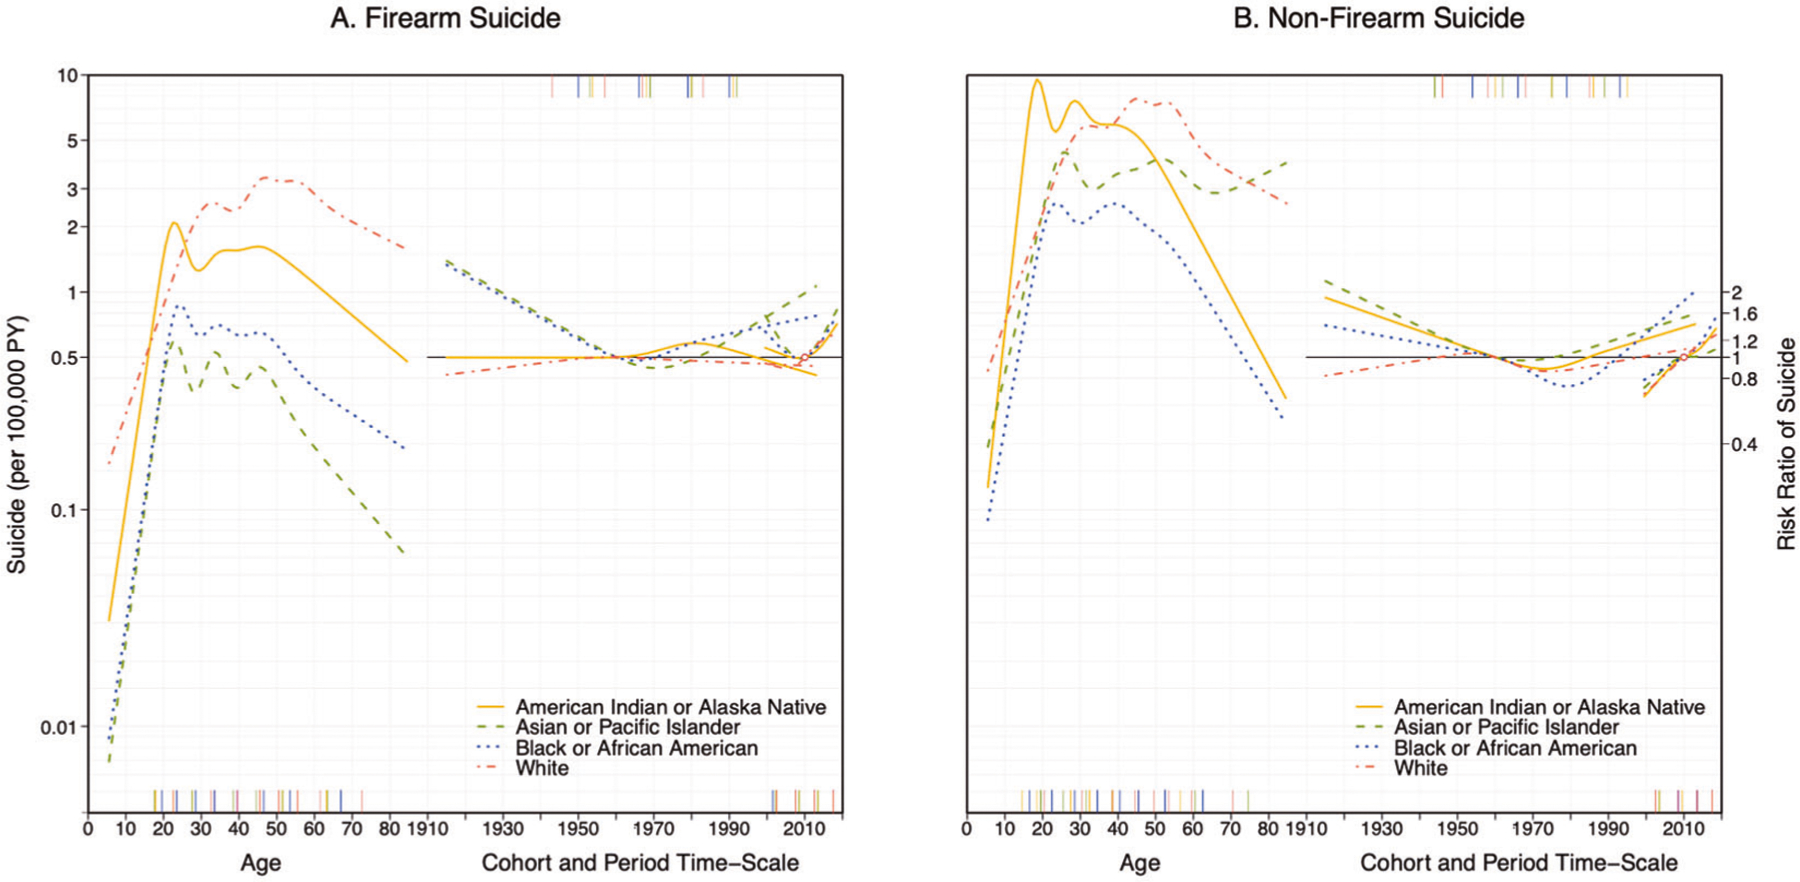
The left axis coincides with the age effect and indicates suicide rates per 100,000 women and is anchored to the reference cohort (1960). The right axis corresponds to the risk ratio comparing each cohort and period to the reference cohort (1960) and period (2010).