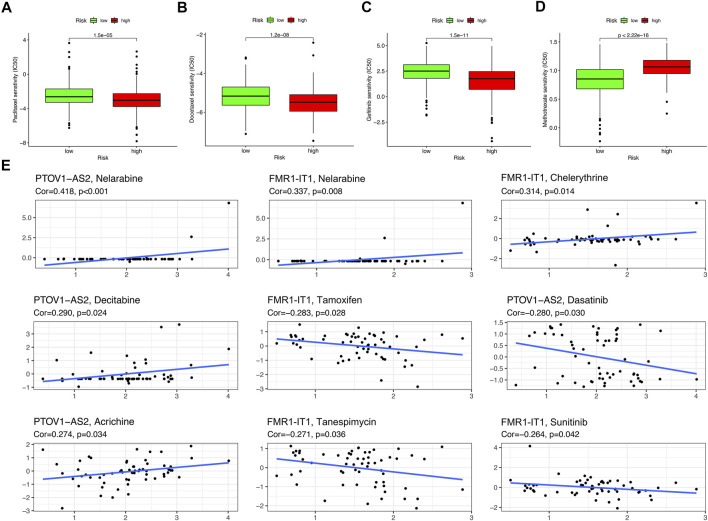
FIGURE 10.
Drug sensitivity analysis. (A–D) The boxplot of Sensitivity of Paclitaxel, Docetaxel, Gefitinib, Methotrexate in patients with high-risk subgroup and low-risk subgroup. (E) The scatter plot showed the correlation between prognostic lncRNAs expression and drug sensitivity (Z score of CellMiner interface). Top 10 associations were displayed, sorted by p value.

