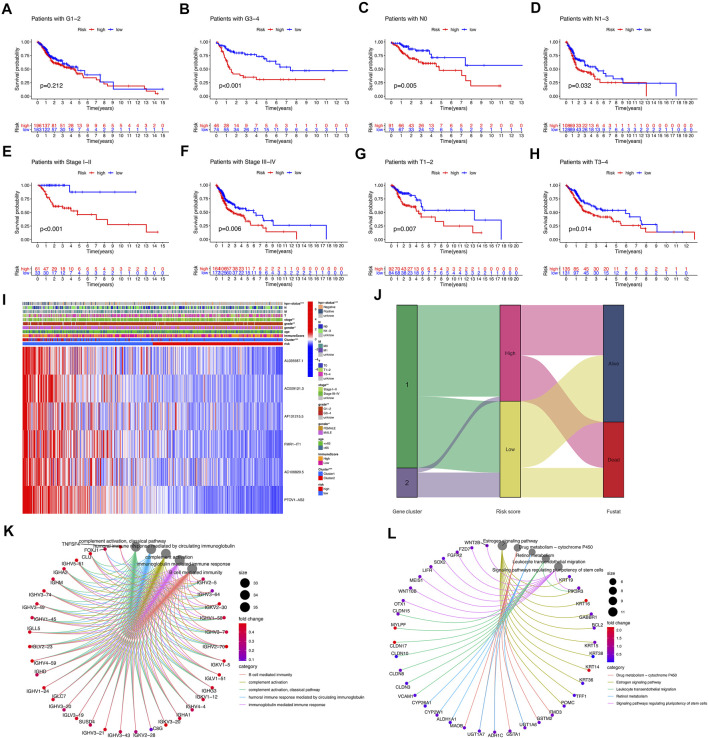
FIGURE 5.
Correlation of risk model subgroups with overall survival and different clinical characteristics in TCGA-HNSCC database. (A–H) Kaplan–Meier curve of the overall survival of patients with different clinical traits in high-risk group and low-risk group. (I) Heatmap of association between expression levels of six prognosis lncRNAs and clinicopathological features in TCGA database. (J) The sankey diagram of the relationship among the cluster, risk score and survival state. (K,L) GO and KEGG analysis.

