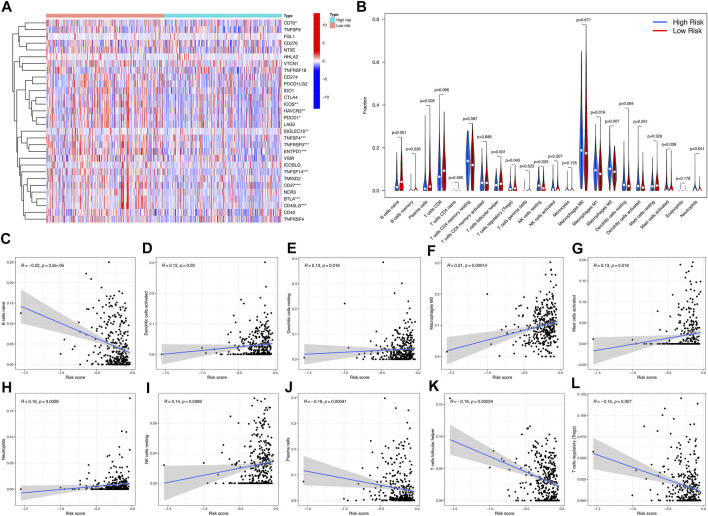
FIGURE 6.
Differences in immune microenvironment between high-risk and low-risk subgroups. (A) Violet plot of the expression of different checkpoint genes between high-risk subgroup and low-risk subgroup. (B) Heatmap of infiltration of different immune cells between high-risk subgroup and low-risk subgroup. (C–L) The correlation between immune cell infiltration and risk score.

