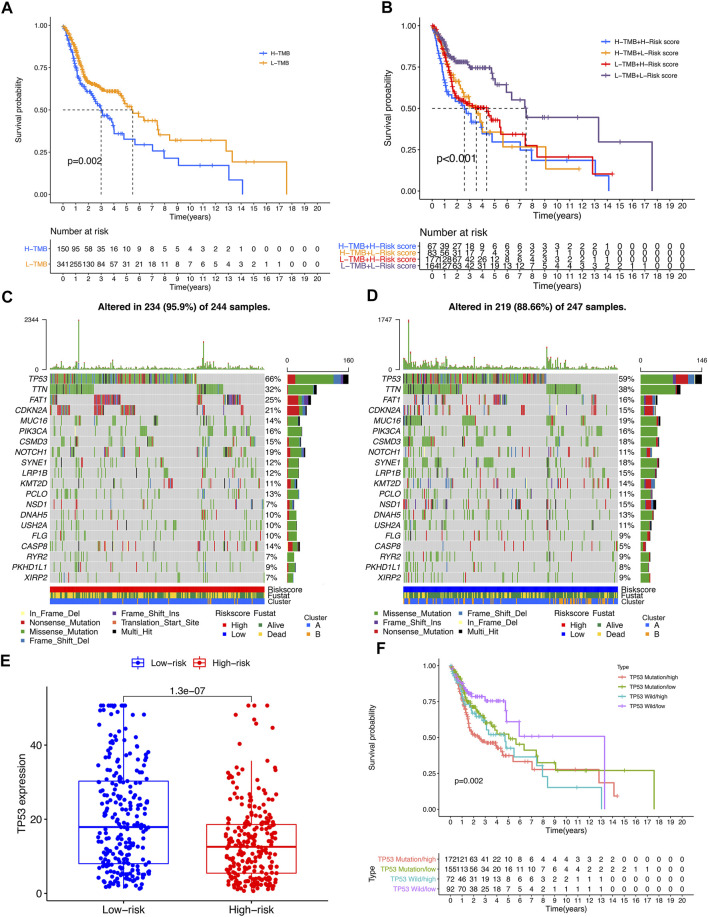
FIGURE 7.
The impact of differential TMB level on patients’ prognosis and TP53 somatic mutation. (A) Comparison of prognosis between high TMB subgroup and low TMB subgroup. (B) Comparison of prognosis of TMB combined with risk score. (C,D) Top 20 genes with the most significant mutation rates in high-risk subgroup and low-risk subgroup. (E) The differential expression level TP53 between high-risk group and low-risk group. (F) Kaplan–Meier curve analysis of overall survival was shown for patients classified according to TP53 mutation status and risk score. TP53-wt: wild type of TP53 sequence; TP53-mt: mutation type of TP53 sequence.

