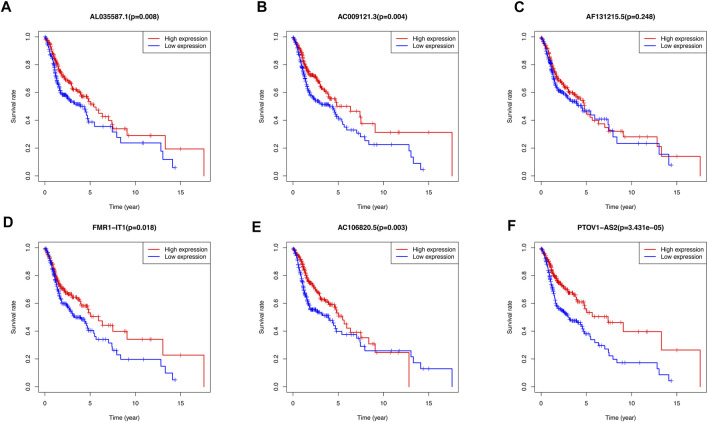
FIGURE 8.
Kaplan-Meier curves of overall survival for differential expression level of 6 m6A/m5C/m1A-related lncRNAs Prognostic signatures respectively. (A) The association of AL035587.1 expression level with patients’ prognosis of TCGA database. (B) The association of AC009121.3 expression level with patients’ prognosis of TCGA database. (C) The association of AF131215.5 expression level with patients’ prognosis of TCGA database. (D) The association of FMR1-IT1 expression level with patients’ prognosis of TCGA database. (E) The association of AC106820.5 expression level with patients’ prognosis of TCGA database. (F) The association of PTOV1-AS2 expression level with patients’ prognosis of TCGA database.

