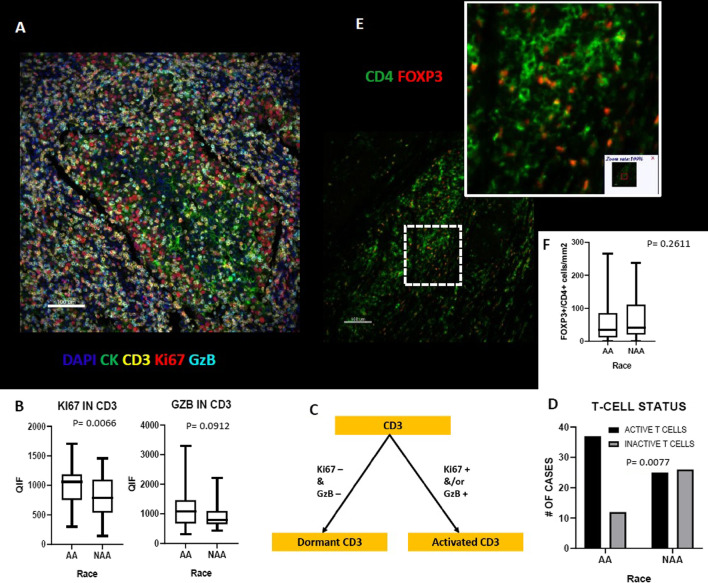
Fig. 3.
Comparison of T-cells status and Regulatory T-Cell population in AA versus Non-AA TNBC. A Representative image of multiplex immunofluorescent staining for CD3, Ki67 and GzB markers B Comparison of Ki67 and GzB in T-cells of AA vs Non-AA TNBC tumors. C Schema of activation status of T cells. D Comparison of the activation status of T-Cell in AA vs Non-AA TNBC tumors. E Representative image of multiplex immunofluorescent staining for CD4 and FOXP3 markers. F Comparison of regulatory T-cell population in AA versus Non-AA TNBC tumors

