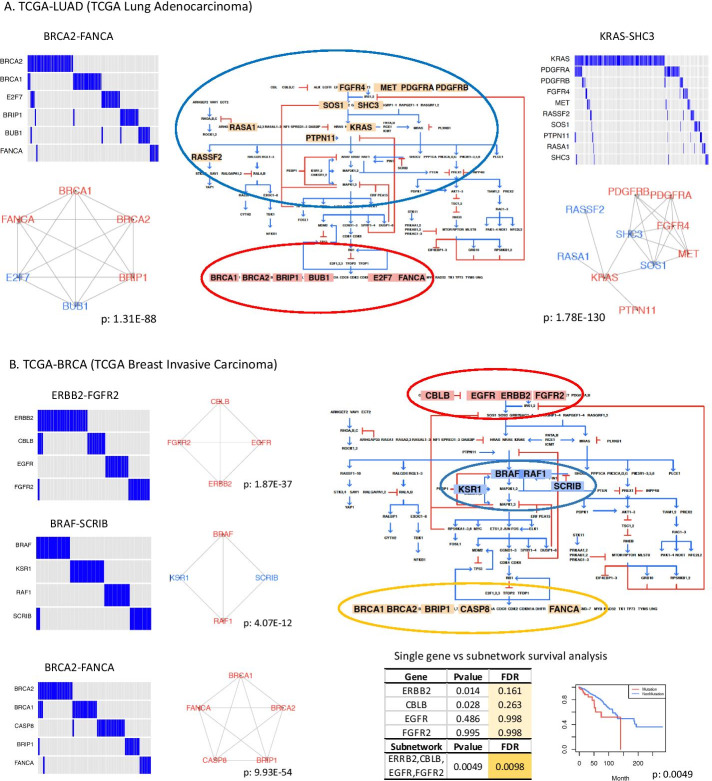
Fig. 2.
Biological implication of subnetworks in the context of pathway. A Subnetworks from TCGA-LUAD (TCGA Lung Adenocarcinoma) are mapped to the RAS pathway. Genes colored in red are present in the COSMIC Cancer Gene Census. Blue oval: genes in KRAS-SHC3; Red oval: genes in BRCA2-FANCA. B Subnetworks from TCGA-BRCA (TCGA Breast Invasive Carcinoma) are mapped to the RAS pathway and associated with survival. Red oval: genes in ERBB2-FGFR2; Blue oval: genes in BRAF-SCRIB; Yellow oval: genes in BRCA2-FANCA. P-values are combined p-values from gene-pair fisher’s tests. The KM-plot of survival analysis is obtained from the comparison of mutated vs. non-mutated samples for four genes in the subnetwork ERBB2-FGFR2. Coxph p-values adjusted by sex and age for both single gene and a group by subnetwork genes are shown in the table

