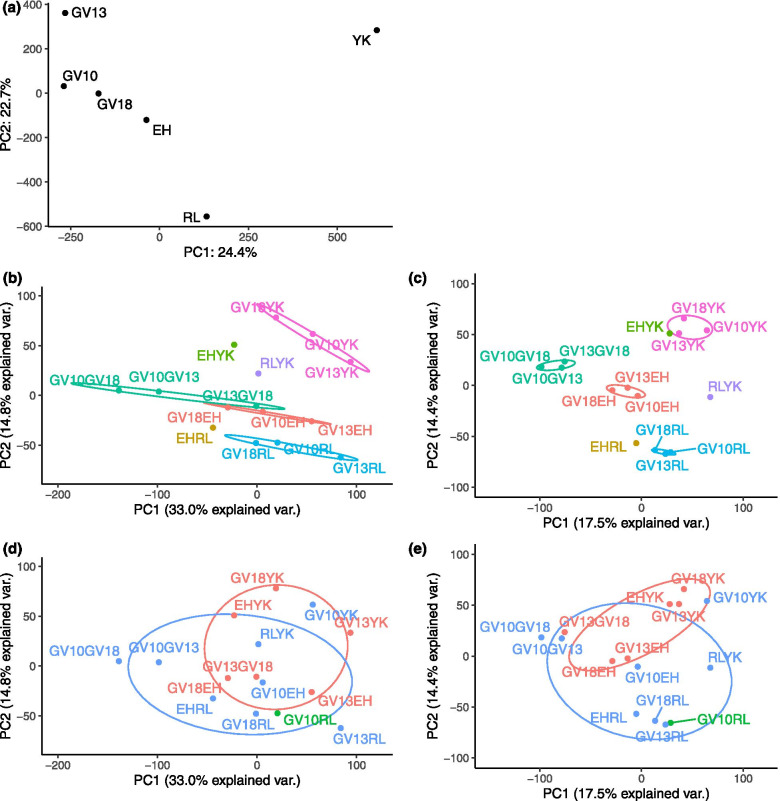
Fig. 4.
Principal components analysis based on MAF or pairwise Fst. PCA plots of (a) allele frequency of Aedes aegypti samples (MAF > 0.1, minimal coverage > 50); (b, d) pairwise Fst throughout the genome with 100 kbp non-overlapping windows, and (c, e) pairwise Fst within genes. Colors in (b, c) represent geographical comparisons. The blue color in (d, e) represents comparisons between Wolbachia-infected and uninfected samples, while red represents comparisons within Wolbachia-infected samples and green represents the comparison within uninfected samples. The 95% confidence ellipses show data clustering

