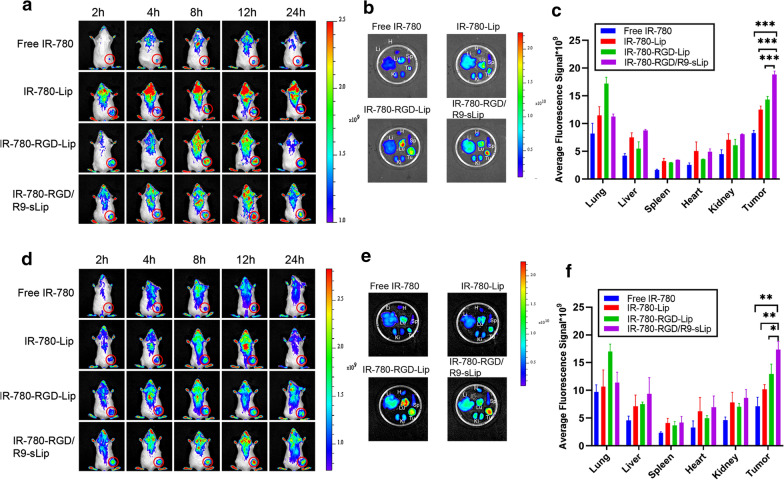
Fig. 5.
In vivo biodistribution of tumor-bearing mice. a Fluorescence signal distribution of CT-26 cell tumor-bearing model at 2, 4, 8, 12, and 24 h post-injection of Free IR-780, IR-780-Lip, IR-780-RGD-Lip and IR-780-RGD/R9-sLip. b Ex vivo fluorescence distribution of hearts (H), livers (Li), spleens (Sp), lungs (Lu), kidneys (Ki) and tumor (Tu). c Fluorescence in major organs and tumors was quantified using IVIS imaging software. d Fluorescence signal distribution of co-cultured cell tumor-bearing model injection of Free IR-780, IR-780-Lip, IR-780-RGD-Lip and IR-780-RGD/R9-sLip. e Ex vivo fluorescence distribution of hearts (H), livers (Li), spleens (Sp), lungs (Lu), kidneys (Ki) and tumor (Tu). f Fluorescence in major organs and tumors was quantified using IVIS imaging software. The red circles represent tumors. *P < 0.05, **P < 0.01, ***P < 0.001

