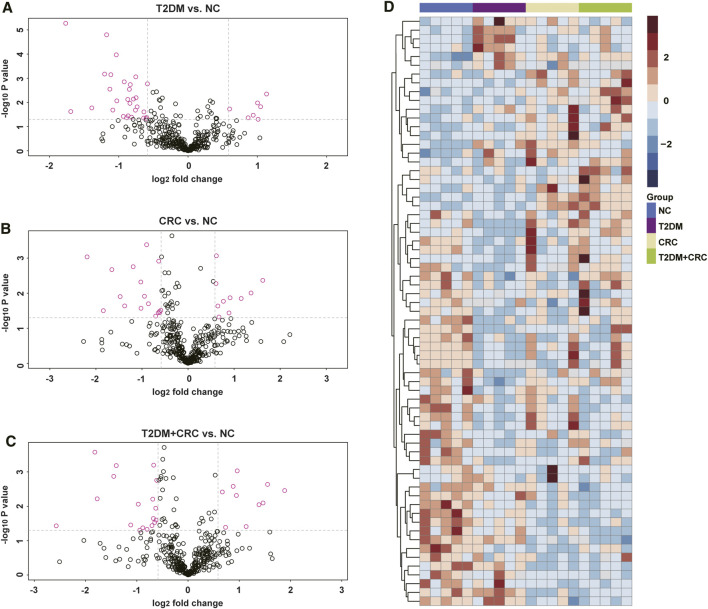
FIGURE 2.
Serum protein profiles in patient cohorts in the current study. (A–C) Volcano plot exhibiting the DAPs in the T2DM, CRC and T2DM + CRC patients in comparison with healthy participants. DAPs were extracted using R language 4.0.0 with a criterion of fold change (FC) ≥ 1.50 or ≤0.67 and unpaired t-test p value ≤0.05. (D) Hierarchical cluster analysis of the 67 DAPs in the groups of healthy participants, T2DM, CRC, and T2DM + CRC. There were five samples in each group. Red represents for high expression and blue represents for low expression.

