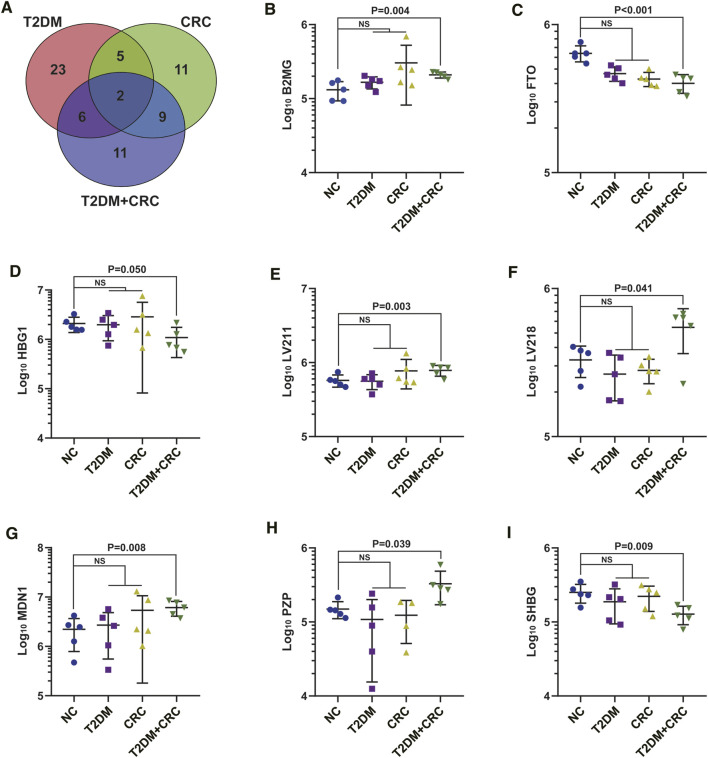
FIGURE 3.
Extraction of specific serum proteins in T2DM + CRC patients. (A) Venn diagram of the 67 DAPs in the serum specimens from the four comparisons (T2DM vs healthy participants, CRC vs healthy participants and T2DM + CRC vs healthy participants). (B–I) Statistical graphs of eight specific proteins levels. Unpaired t-test was used to compare the potential difference.

