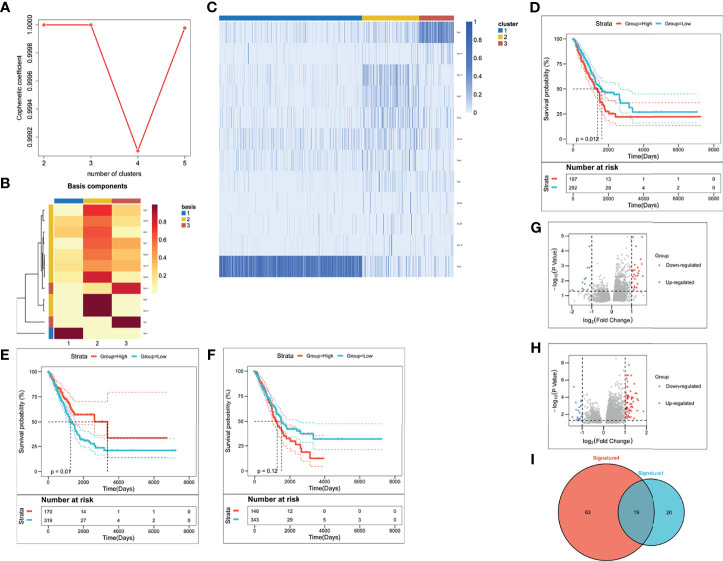
Figure 1.
The identification of LUAD-related immune biomarkers. (A) The diagnostic diagram of mutation signature for setting cophenetic correlation coefficient value as three. (B) The evaluation of weight scores for each mutation signature in each sample by setting 6% as cut-off value. (C) The identification of driving mutation signatures. (D–F) Kaplan–Meier curves of signature 1 (D), signature 4 (E), and signature 13 (F). (G, H) The selection of differentially expressed genes in signature 1 (G) and signature 4 (H). (I) There were thirty-nine DEGs in signature 1 and eighty-two DEGs in signature 4.

